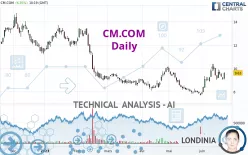
CM.COM - Daily - Technical analysis published on 06/22/2023 (GMT)
- 153
- 0
Click here for a new analysis!
- Timeframe : Daily
- - Analysis generated on
- Status : LEVEL MAINTAINED

Summary of the analysis

Additional analysis
Quotes
The CM.COM rating is 9.630 EUR. The price has increased by +6.35% since the last closing and was between 9.070 EUR and 9.685 EUR. This implies that the price is at +6.17% from its lowest and at -0.57% from its highest.The Central Gaps scanner detects a bullish opening marking the presence of buyers ahead of sellers at the opening but not sufficiently marked to allow the price to register a quotation gap.
Bullish opening
Type : Bullish
Timeframe : Openning
Here is a more detailed summary of the historical variations registered by CM.COM:
Abnormal volumes
Timeframe : 20 days
Technical
A technical analysis in Daily of this CM.COM chart shows a bullish trend. 67.86% of the signals given by moving averages are bullish. This bullish trend is supported by the strong bullish signals given by short-term moving averages. The Central Indicators market scanner is currently detecting several bullish signals that could impact this trend:
Bullish price crossover with Moving Average 100
Type : Bullish
Timeframe : Daily
Bullish price crossover with adaptative moving average 100
Type : Bullish
Timeframe : Daily
The technical indicators are bullish. There is still some doubt about the price increase.
Central Indicators, the detector scanner for these technical indicators has recently detected several signals:
Pivot points : price is over resistance 3
Type : Neutral
Timeframe : Daily
Ichimoku : price is over the cloud
Type : Bullish
Timeframe : Daily
Momentum indicator is back over 0
Type : Bullish
Timeframe : Daily
Williams %R indicator is back over -50
Type : Bullish
Timeframe : Daily
The analysis of the price chart with Central Patterns scanners does not return any result.
For a small rebound in the very short term, the Central Candlesticks scanner currently notes the presence of this bullish pattern in Japanese candlesticks:
White morning star
Type : Bullish
Timeframe : Daily
| S3 | S2 | S1 | Price | R1 | R2 | R3 | |
|---|---|---|---|---|---|---|---|
| ProTrendLines | 7.710 | 8.330 | 9.037 | 9.630 | 10.163 | 11.360 | 13.415 |
| Change (%) | -19.94% | -13.50% | -6.16% | - | +5.53% | +17.96% | +39.30% |
| Change | -1.920 | -1.300 | -0.593 | - | +0.533 | +1.730 | +3.785 |
| Level | Major | Major | Major | - | Minor | Minor | Intermediate |
To determine price objectives, it is also possible to use the pivot points. Here is the price position in relation to pivot points:
| Pivot points | S3 | S2 | S1 | PP | R1 | R2 | R3 |
|---|---|---|---|---|---|---|---|
| Standard | 8.748 | 8.902 | 8.978 | 9.132 | 9.208 | 9.362 | 9.438 |
| Camarilla | 8.992 | 9.013 | 9.034 | 9.055 | 9.076 | 9.097 | 9.118 |
| Woodie | 8.710 | 8.883 | 8.940 | 9.113 | 9.170 | 9.343 | 9.400 |
| Fibonacci | 8.902 | 8.990 | 9.044 | 9.132 | 9.220 | 9.274 | 9.362 |
| Pivot points | S3 | S2 | S1 | PP | R1 | R2 | R3 |
|---|---|---|---|---|---|---|---|
| Standard | 7.618 | 8.322 | 8.993 | 9.697 | 10.368 | 11.072 | 11.743 |
| Camarilla | 9.287 | 9.413 | 9.539 | 9.665 | 9.791 | 9.917 | 10.043 |
| Woodie | 7.603 | 8.314 | 8.978 | 9.689 | 10.353 | 11.064 | 11.728 |
| Fibonacci | 8.322 | 8.847 | 9.171 | 9.697 | 10.222 | 10.546 | 11.072 |
| Pivot points | S3 | S2 | S1 | PP | R1 | R2 | R3 |
|---|---|---|---|---|---|---|---|
| Standard | 4.457 | 6.083 | 6.897 | 8.523 | 9.337 | 10.963 | 11.777 |
| Camarilla | 7.039 | 7.263 | 7.486 | 7.710 | 7.934 | 8.157 | 8.381 |
| Woodie | 4.050 | 5.880 | 6.490 | 8.320 | 8.930 | 10.760 | 11.370 |
| Fibonacci | 6.083 | 7.015 | 7.591 | 8.523 | 9.455 | 10.031 | 10.963 |
Numerical data
The following is the status of technical indicators and moving averages registered at the time this technical analysis was created:
| RSI (14): | 57.42 | |
| MACD (12,26,9): | 0.2350 | |
| Directional Movement: | 13.583 | |
| AROON (14): | 50.000 | |
| DEMA (21): | 9.440 | |
| Parabolic SAR (0,02-0,02-0,2): | 10.373 | |
| Elder Ray (13): | 0.081 | |
| Super Trend (3,10): | 8.843 | |
| Zig ZAG (10): | 9.600 | |
| VORTEX (21): | 1.1140 | |
| Stochastique (14,3,5): | 54.94 | |
| TEMA (21): | 9.661 | |
| Williams %R (14): | -39.02 | |
| Chande Momentum Oscillator (20): | 0.595 | |
| Repulse (5,40,3): | 2.3830 | |
| ROCnROLL: | 1 | |
| TRIX (15,9): | 0.3530 | |
| Courbe Coppock: | 29.64 |
| MA7: | 9.396 | |
| MA20: | 9.004 | |
| MA50: | 8.871 | |
| MA100: | 9.356 | |
| MAexp7: | 9.410 | |
| MAexp20: | 9.160 | |
| MAexp50: | 9.059 | |
| MAexp100: | 9.523 | |
| Price / MA7: | +2.49% | |
| Price / MA20: | +6.95% | |
| Price / MA50: | +8.56% | |
| Price / MA100: | +2.93% | |
| Price / MAexp7: | +2.34% | |
| Price / MAexp20: | +5.13% | |
| Price / MAexp50: | +6.30% | |
| Price / MAexp100: | +1.12% |
News
The latest news and videos published on CM.COM at the time of the analysis were as follows:
- CM.com Wins Exclusive Ticketing Deal with Glamorgan Cricket
- CM.com Recognized as a Major Player in the 2021 IDC MarketScape for the Worldwide Communication Platform as a Service (CPaaS) Market
- CM.com Commended by Frost & Sullivan for Delivering Next-level Conversational Experiences with Its Conversational AI Cloud
- CM.com opens its first US office in Los Angeles, California
About author
Online


Add a comment
Comments
0 comments on the analysis CM.COM - Daily