NAVIENT CORP. - Daily - Technical analysis published on 09/30/2019 (GMT)
- 203
- 0
- Who voted?
Click here for a new analysis!
- Timeframe : Daily
- - Analysis generated on
- Status : TARGET REACHED

Summary of the analysis

Additional analysis
Quotes
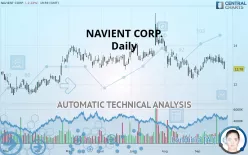
The NAVIENT CORP. price is 12.78 USD. The price is lower by -2.22% since the last closing with the lowest point at 12.77 USD and the highest point at 13.20 USD. The deviation from the price is +0.08% for the low point and -3.18% for the high point.A bullish opening was detected by the Central Gaps scanner. Buyers are trying to impose a bullish momentum in the very short term.
Bullish opening
Type : Bullish
Timeframe : Openning
A study of price movements over other periods shows the following variations:
Technical
Technical analysis of this Daily chart of NAVIENT CORP. indicates that the overall trend is bearish. The signals given by moving averages are at 75% bearish. This bearish trend shows slight signs of slowing down given the slightly bearish signals of short-term moving averages. The Central Indicators scanner detects bearish signals on moving averages that could impact this trend:
Bearish trend reversal : adaptative moving average 20
Type : Bearish
Timeframe : Daily
Bearish trend reversal : adaptative moving average 50
Type : Bearish
Timeframe : Daily
Bearish price crossover with Moving Average 50
Type : Bearish
Timeframe : Daily
Bearish price crossover with Moving Average 100
Type : Bearish
Timeframe : Daily
Bearish price crossover with adaptative moving average 20
Type : Bearish
Timeframe : Daily
Bearish price crossover with adaptative moving average 100
Type : Bearish
Timeframe : Daily
An assessment of technical indicators does not currently provide any relevant information to suggest whether the signal given by the technical indicators is more bullish or bearish.
Central Indicators, the scanner specialised in technical indicators, has identified these signals:
Pivot points : price is under support 1
Type : Neutral
Timeframe : Daily
Pivot points : price is under support 3
Type : Neutral
Timeframe : Weekly
RSI indicator is back under 50
Type : Bearish
Timeframe : Daily
Momentum indicator is back under 0
Type : Bearish
Timeframe : Daily
Williams %R indicator is back under -50
Type : Bearish
Timeframe : Daily
An analysis of the price chart with the Central Patterns scanner (detector of chart patterns and resistances and supports) shows a result that can have an impact on the price change:
Near support of triangle
Type : Bullish
Timeframe : Daily
No result was found by the Central Candlesticks scanner on Japanese candlesticks.
| S2 | S1 | Price | R1 | R2 | R3 | |
|---|---|---|---|---|---|---|
| ProTrendLines | 8.42 | 11.62 | 12.78 | 12.81 | 13.38 | 13.94 |
| Change (%) | -34.12% | -9.08% | - | +0.23% | +4.69% | +9.08% |
| Change | -4.36 | -1.16 | - | +0.03 | +0.60 | +1.16 |
| Level | Intermediate | Intermediate | - | Major | Intermediate | Intermediate |
Attention could also be paid to pivot points to set price objectives:
| Pivot points | S3 | S2 | S1 | PP | R1 | R2 | R3 |
|---|---|---|---|---|---|---|---|
| Standard | 12.55 | 12.76 | 12.92 | 13.13 | 13.29 | 13.50 | 13.66 |
| Camarilla | 12.97 | 13.00 | 13.04 | 13.07 | 13.10 | 13.14 | 13.17 |
| Woodie | 12.52 | 12.75 | 12.89 | 13.12 | 13.26 | 13.49 | 13.63 |
| Fibonacci | 12.76 | 12.91 | 12.99 | 13.13 | 13.28 | 13.36 | 13.50 |
| Pivot points | S3 | S2 | S1 | PP | R1 | R2 | R3 |
|---|---|---|---|---|---|---|---|
| Standard | 12.58 | 12.81 | 13.02 | 13.25 | 13.46 | 13.69 | 13.90 |
| Camarilla | 13.10 | 13.14 | 13.18 | 13.22 | 13.26 | 13.30 | 13.34 |
| Woodie | 12.56 | 12.81 | 13.00 | 13.25 | 13.44 | 13.69 | 13.88 |
| Fibonacci | 12.81 | 12.98 | 13.09 | 13.25 | 13.42 | 13.53 | 13.69 |
| Pivot points | S3 | S2 | S1 | PP | R1 | R2 | R3 |
|---|---|---|---|---|---|---|---|
| Standard | 9.77 | 10.93 | 11.75 | 12.91 | 13.74 | 14.90 | 15.72 |
| Camarilla | 12.03 | 12.22 | 12.40 | 12.58 | 12.76 | 12.94 | 13.12 |
| Woodie | 9.60 | 10.84 | 11.59 | 12.83 | 13.57 | 14.81 | 15.56 |
| Fibonacci | 10.93 | 11.69 | 12.15 | 12.91 | 13.67 | 14.14 | 14.90 |
Numerical data
The following is the status of technical indicators and moving averages registered at the time this technical analysis was created:
| RSI (14): | 43.57 | |
| MACD (12,26,9): | 0.0300 | |
| Directional Movement: | -4.06 | |
| AROON (14): | -71.43 | |
| DEMA (21): | 13.12 | |
| Parabolic SAR (0,02-0,02-0,2): | 13.53 | |
| Elder Ray (13): | -0.12 | |
| Super Trend (3,10): | 13.47 | |
| Zig ZAG (10): | 12.78 | |
| VORTEX (21): | 1.0400 | |
| Stochastique (14,3,5): | 31.89 | |
| TEMA (21): | 13.18 | |
| Williams %R (14): | -98.10 | |
| Chande Momentum Oscillator (20): | -0.61 | |
| Repulse (5,40,3): | -5.1700 | |
| ROCnROLL: | 2 | |
| TRIX (15,9): | 0.0600 | |
| Courbe Coppock: | 4.51 |
| MA7: | 13.14 | |
| MA20: | 13.07 | |
| MA50: | 13.16 | |
| MA100: | 13.15 | |
| MAexp7: | 13.09 | |
| MAexp20: | 13.09 | |
| MAexp50: | 13.08 | |
| MAexp100: | 12.94 | |
| Price / MA7: | -2.74% | |
| Price / MA20: | -2.22% | |
| Price / MA50: | -2.89% | |
| Price / MA100: | -2.81% | |
| Price / MAexp7: | -2.37% | |
| Price / MAexp20: | -2.37% | |
| Price / MAexp50: | -2.29% | |
| Price / MAexp100: | -1.24% |
News
Don"t forget to follow the news on NAVIENT CORP.. At the time of publication of this analysis, the latest news was as follows:
- NAVIENT INVESTIGATION INITIATED BY FORMER LOUISIANA ATTORNEY GENERAL: Kahn Swick & Foti, LLC Investigates the Officers and Directors of Navient Corporation - NAVI
-
 Navient
- Navient CEO to present at 2017 Credit Suisse Financial Services Forum
- Navient posts fourth quarter and full-year 2016 financial results
- Moore Kuehn, PLLC Announces an Investigation Involving Possible Consumer Fraud by Navient Corp. and Breaches of Fiduciary Duties by Officers and Directors
About author

Online


Add a comment
Comments
0 comments on the analysis NAVIENT CORP. - Daily