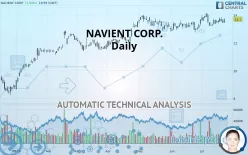
NAVIENT CORP. - Daily - Technical analysis published on 07/24/2019 (GMT)
- 288
- 0
- Who voted?
Click here for a new analysis!
- Timeframe : Daily
- - Analysis generated on
- Status : TARGET REACHED

Summary of the analysis

Additional analysis
Quotes
The NAVIENT CORP. price is 13.70 USD. On the day, this instrument gained +1.94% and was between 13.43 USD and 13.76 USD. This implies that the price is at +2.01% from its lowest and at -0.44% from its highest.A bullish opening was detected by the Central Gaps scanner. Buyers are trying to impose a bullish momentum in the very short term.
Bullish opening
Type : Bullish
Timeframe : Openning
So that you have an overall view of the price change, here is a table showing the variations over several periods:
Near a new HIGH record (1st january)
Type : Bullish
Timeframe : Weekly
Near a new HIGH record (1 month)
Type : Bullish
Timeframe : Weekly
Technical
Technical analysis of NAVIENT CORP. in Daily shows a strongly overall bullish trend. 85.71% of the signals given by moving averages are bullish. This strongly bullish trend is supported by the strong bullish signals given by short-term moving averages. The Central Indicators scanner detects a bullish signal on moving averages that could impact this trend:
Bullish price crossover with Moving Average 20
Type : Bullish
Timeframe : Daily
The probability of a further increase are moderate given the direction of the technical indicators.
But beware of excesses. The Central Indicators scanner currently detects this:
MACD indicator: bullish divergence
Type : Bullish
Timeframe : Daily
Williams %R indicator is overbought : over -20
Type : Neutral
Timeframe : Daily
Pivot points : price is over resistance 1
Type : Neutral
Timeframe : Daily
RSI indicator is back over 50
Type : Bullish
Timeframe : Daily
Price is back under the pivot point
Type : Bearish
Timeframe : Daily
Price is back under the pivot point
Type : Bearish
Timeframe : Weekly
Williams %R indicator is back over -50
Type : Bullish
Timeframe : Daily
The analysis of the price chart with Central Patterns scanners does not return any result.
The Central Candlesticks scanner, specialised in Japanese candlesticks, did not identify any signals.
| S3 | S2 | S1 | Price | R1 | R2 | R3 | |
|---|---|---|---|---|---|---|---|
| ProTrendLines | 10.73 | 11.63 | 12.81 | 13.70 | 13.94 | 14.91 | 16.81 |
| Change (%) | -21.68% | -15.11% | -6.50% | - | +1.75% | +8.83% | +22.70% |
| Change | -2.97 | -2.07 | -0.89 | - | +0.24 | +1.21 | +3.11 |
| Level | Minor | Intermediate | Major | - | Major | Minor | Minor |
To determine price objectives, it is also possible to use the pivot points. Here is the price position in relation to pivot points:
| Pivot points | S3 | S2 | S1 | PP | R1 | R2 | R3 |
|---|---|---|---|---|---|---|---|
| Standard | 13.03 | 13.23 | 13.33 | 13.53 | 13.63 | 13.83 | 13.93 |
| Camarilla | 13.36 | 13.39 | 13.41 | 13.44 | 13.47 | 13.50 | 13.52 |
| Woodie | 12.99 | 13.21 | 13.29 | 13.51 | 13.59 | 13.81 | 13.89 |
| Fibonacci | 13.23 | 13.34 | 13.41 | 13.53 | 13.64 | 13.71 | 13.83 |
| Pivot points | S3 | S2 | S1 | PP | R1 | R2 | R3 |
|---|---|---|---|---|---|---|---|
| Standard | 12.81 | 13.08 | 13.31 | 13.58 | 13.81 | 14.08 | 14.31 |
| Camarilla | 13.41 | 13.46 | 13.50 | 13.55 | 13.60 | 13.64 | 13.69 |
| Woodie | 12.80 | 13.07 | 13.30 | 13.57 | 13.80 | 14.07 | 14.30 |
| Fibonacci | 13.08 | 13.27 | 13.39 | 13.58 | 13.77 | 13.89 | 14.08 |
| Pivot points | S3 | S2 | S1 | PP | R1 | R2 | R3 |
|---|---|---|---|---|---|---|---|
| Standard | 12.10 | 12.42 | 13.04 | 13.36 | 13.98 | 14.30 | 14.92 |
| Camarilla | 13.39 | 13.48 | 13.56 | 13.65 | 13.74 | 13.82 | 13.91 |
| Woodie | 12.24 | 12.50 | 13.18 | 13.44 | 14.12 | 14.38 | 15.06 |
| Fibonacci | 12.42 | 12.78 | 13.00 | 13.36 | 13.72 | 13.94 | 14.30 |
Numerical data
The following is the status of the technical indicators and moving averages at the time of publication of this technical analysis:
| RSI (14): | 55.31 | |
| MACD (12,26,9): | 0.0700 | |
| Directional Movement: | 7.18 | |
| AROON (14): | -28.57 | |
| DEMA (21): | 13.60 | |
| Parabolic SAR (0,02-0,02-0,2): | 14.13 | |
| Elder Ray (13): | 0.06 | |
| Super Trend (3,10): | 13.01 | |
| Zig ZAG (10): | 13.70 | |
| VORTEX (21): | 1.0100 | |
| Stochastique (14,3,5): | 39.30 | |
| TEMA (21): | 13.60 | |
| Williams %R (14): | -46.32 | |
| Chande Momentum Oscillator (20): | -0.40 | |
| Repulse (5,40,3): | 0.2700 | |
| ROCnROLL: | 1 | |
| TRIX (15,9): | 0.0800 | |
| Courbe Coppock: | 0.42 |
| MA7: | 13.55 | |
| MA20: | 13.51 | |
| MA50: | 13.36 | |
| MA100: | 12.87 | |
| MAexp7: | 13.57 | |
| MAexp20: | 13.50 | |
| MAexp50: | 13.31 | |
| MAexp100: | 12.95 | |
| Price / MA7: | +1.11% | |
| Price / MA20: | +1.41% | |
| Price / MA50: | +2.54% | |
| Price / MA100: | +6.45% | |
| Price / MAexp7: | +0.96% | |
| Price / MAexp20: | +1.48% | |
| Price / MAexp50: | +2.93% | |
| Price / MAexp100: | +5.79% |
News
Don"t forget to follow the news on NAVIENT CORP.. At the time of publication of this analysis, the latest news was as follows:
- NAVIENT INVESTIGATION INITIATED BY FORMER LOUISIANA ATTORNEY GENERAL: Kahn Swick & Foti, LLC Investigates the Officers and Directors of Navient Corporation - NAVI
-
 Navient
- Navient CEO to present at 2017 Credit Suisse Financial Services Forum
- Navient posts fourth quarter and full-year 2016 financial results
- Moore Kuehn, PLLC Announces an Investigation Involving Possible Consumer Fraud by Navient Corp. and Breaches of Fiduciary Duties by Officers and Directors
About author

Online


Add a comment
Comments
0 comments on the analysis NAVIENT CORP. - Daily