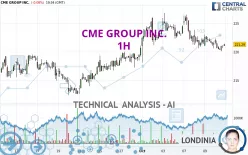
CME GROUP INC. - 1H - Technical analysis published on 10/10/2024 (GMT)
- 150
- 0
Click here for a new analysis!
- Timeframe : 1H
- - Analysis generated on
- Status : LEVEL MAINTAINED

Summary of the analysis

Additional analysis
Quotes
The CME GROUP INC. price is 221.29 USD. On the day, this instrument lost -0.08% and was traded between 220.11 USD and 222.35 USD over the period. The price is currently at +0.54% from its lowest and -0.48% from its highest.Here is a more detailed summary of the historical variations registered by CME GROUP INC.:
Near a new HIGH record (5 years)
Type : Bullish
Timeframe : Weekly
Near a new HIGH record (1 year)
Type : Bullish
Timeframe : Weekly
Near a new HIGH record (1st january)
Type : Bullish
Timeframe : Weekly
Near a new LOW record (1 month)
Type : Bearish
Timeframe : Weekly
Technical
A technical analysis in 1H of this CME GROUP INC. chart shows a neutral trend. This indecision could turn into a bearish trend due to the strong bearish signals currently being given by short-term moving averages. There is no crossing of moving average by the price or crossing of moving averages between themselves.
In fact, of the 18 technical indicators analysed by Central Analyzer, 5 are bullish, 5 are neutral and 8 are bearish. Central Indicators, the scanner specialised in technical indicators, has identified this signal:
Price is back under the pivot point
Type : Bearish
Timeframe : Weekly
An analysis of the price chart with the Central Patterns scanner (detector of chart patterns and resistances and supports) shows several results that can have an impact on the price change:
Near horizontal support
Type : Bullish
Timeframe : 1 hour
Support of channel is broken
Type : Bearish
Timeframe : 1 hour
The Central Candlesticks scanner, specialised in Japanese candlesticks, did not identify any signals.
| S3 | S2 | S1 | Price | R1 | R2 | |
|---|---|---|---|---|---|---|
| ProTrendLines | 214.81 | 217.79 | 219.43 | 221.29 | 222.26 | 225.62 |
| Change (%) | -2.93% | -1.58% | -0.84% | - | +0.44% | +1.96% |
| Change | -6.48 | -3.50 | -1.86 | - | +0.97 | +4.33 |
| Level | Intermediate | Major | Intermediate | - | Minor | Major |
Attention could also be paid to pivot points to set price objectives:
| Pivot points | S3 | S2 | S1 | PP | R1 | R2 | R3 |
|---|---|---|---|---|---|---|---|
| Standard | 217.89 | 219.23 | 220.34 | 221.68 | 222.79 | 224.13 | 225.24 |
| Camarilla | 220.79 | 221.01 | 221.24 | 221.46 | 221.69 | 221.91 | 222.13 |
| Woodie | 217.79 | 219.17 | 220.24 | 221.62 | 222.69 | 224.07 | 225.14 |
| Fibonacci | 219.23 | 220.16 | 220.74 | 221.68 | 222.61 | 223.19 | 224.13 |
| Pivot points | S3 | S2 | S1 | PP | R1 | R2 | R3 |
|---|---|---|---|---|---|---|---|
| Standard | 209.30 | 213.26 | 218.85 | 222.81 | 228.40 | 232.36 | 237.95 |
| Camarilla | 221.80 | 222.68 | 223.56 | 224.43 | 225.31 | 226.18 | 227.06 |
| Woodie | 210.11 | 213.67 | 219.66 | 223.22 | 229.21 | 232.77 | 238.76 |
| Fibonacci | 213.26 | 216.91 | 219.17 | 222.81 | 226.46 | 228.72 | 232.36 |
| Pivot points | S3 | S2 | S1 | PP | R1 | R2 | R3 |
|---|---|---|---|---|---|---|---|
| Standard | 196.76 | 201.72 | 211.18 | 216.14 | 225.60 | 230.56 | 240.02 |
| Camarilla | 216.69 | 218.01 | 219.33 | 220.65 | 221.97 | 223.29 | 224.62 |
| Woodie | 199.02 | 202.85 | 213.44 | 217.27 | 227.86 | 231.69 | 242.28 |
| Fibonacci | 201.72 | 207.23 | 210.63 | 216.14 | 221.65 | 225.05 | 230.56 |
Numerical data
The following is the status of the technical indicators and moving averages at the time of publication of this technical analysis:
| RSI (14): | 44.14 | |
| MACD (12,26,9): | -0.5400 | |
| Directional Movement: | -2.74 | |
| AROON (14): | -78.57 | |
| DEMA (21): | 220.93 | |
| Parabolic SAR (0,02-0,02-0,2): | 222.11 | |
| Elder Ray (13): | -0.40 | |
| Super Trend (3,10): | 223.52 | |
| Zig ZAG (10): | 221.07 | |
| VORTEX (21): | 0.9400 | |
| Stochastique (14,3,5): | 20.10 | |
| TEMA (21): | 220.44 | |
| Williams %R (14): | -69.66 | |
| Chande Momentum Oscillator (20): | -1.62 | |
| Repulse (5,40,3): | 0.1000 | |
| ROCnROLL: | 2 | |
| TRIX (15,9): | -0.0300 | |
| Courbe Coppock: | 0.92 |
| MA7: | 222.59 | |
| MA20: | 219.52 | |
| MA50: | 213.21 | |
| MA100: | 205.69 | |
| MAexp7: | 220.98 | |
| MAexp20: | 221.61 | |
| MAexp50: | 221.81 | |
| MAexp100: | 220.63 | |
| Price / MA7: | -0.58% | |
| Price / MA20: | +0.81% | |
| Price / MA50: | +3.79% | |
| Price / MA100: | +7.58% | |
| Price / MAexp7: | +0.14% | |
| Price / MAexp20: | -0.14% | |
| Price / MAexp50: | -0.23% | |
| Price / MAexp100: | +0.30% |
News
The latest news and videos published on CME GROUP INC. at the time of the analysis were as follows:
- CME Group Inc. Reports First-Quarter 2023 Financial Results
- CME Group Completes Key Milestones in Conversion of Eurodollar Futures, Options and Cleared Swaps to SOFR-Based Derivatives
- CME Group to Expand Bitcoin and Ether Options Expiries on May 22
- Commodity price outlook and interest rate concerns cloud farmer sentiment
- CME Group Reports Second-Highest March and Quarterly ADV on Record
About author
Online


Add a comment
Comments
0 comments on the analysis CME GROUP INC. - 1H