CME GROUP INC. - 1H - Technical analysis published on 10/03/2023 (GMT)
- 2031
- 0
Click here for a new analysis!
- Timeframe : 1H
- - Analysis generated on
- Status : TARGET REACHED
Summary of the analysis

Additional analysis
Quotes
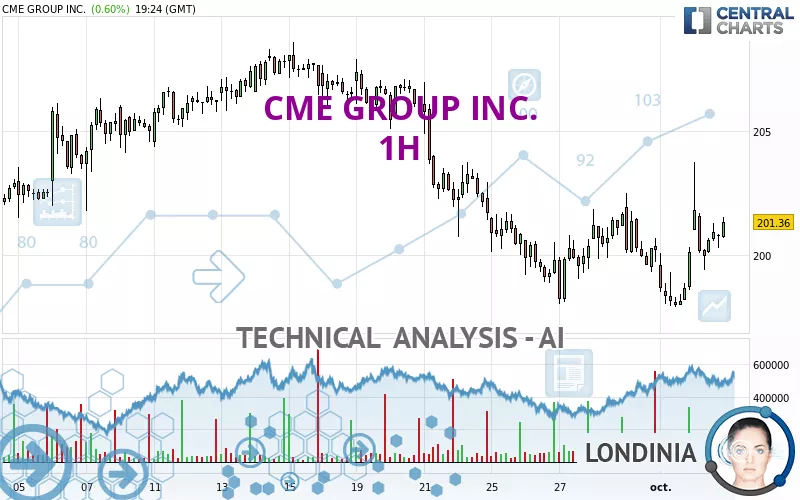
CME GROUP INC. rating 201.53 USD. On the day, this instrument gained +0.69% and was traded between 199.41 USD and 203.76 USD over the period. The price is currently at +1.06% from its lowest and -1.09% from its highest.A bullish gap was detected at the opening by the Central Gaps scanner. There are a lot of buyers and they have the upper hand in the very short term.
Opening Gap UP
Type : Bullish
Timeframe : Openning
A study of price movements over other periods shows the following variations:
Near a new HIGH record (1 year)
Type : Bullish
Timeframe : Weekly
Near a new HIGH record (1st january)
Type : Bullish
Timeframe : Weekly
Near a new HIGH record (1 month)
Type : Bullish
Timeframe : Weekly
Technical
Technical analysis of this 1H chart of CME GROUP INC. indicates that the overall trend is slightly bearish. Only 57.14% of the signals given by moving averages are bearish. This slightly bearish trend could quickly be reversed due to the strong bullish signals currently being given by short-term moving averages. The Central Indicators scanner does not detect any result on moving averages that would impact this trend.
Technical indicators are strongly bullish, suggesting that the price increase should continue.
Other results related to technical indicators were also found by the Central Indicators scanner:
Pivot points : price is over resistance 1
Type : Neutral
Timeframe : 1 hour
Price is back over the pivot point
Type : Bullish
Timeframe : Weekly
Williams %R indicator is back over -50
Type : Bullish
Timeframe : 1 hour
An analysis of the price chart with the Central Patterns scanner (detector of chart patterns and resistances and supports) shows several results that can have an impact on the price change:
Near horizontal resistance
Type : Bearish
Timeframe : 1 hour
Resistance of channel is broken
Type : Bullish
Timeframe : 1 hour
The Central Candlesticks scanner which studies Japanese candlesticks did not detect anything.
| S3 | S2 | S1 | Price | R1 | R2 | R3 | |
|---|---|---|---|---|---|---|---|
| ProTrendLines | 198.06 | 199.22 | 200.46 | 201.53 | 202.22 | 203.68 | 207.81 |
| Change (%) | -1.72% | -1.15% | -0.53% | - | +0.34% | +1.07% | +3.12% |
| Change | -3.47 | -2.31 | -1.07 | - | +0.69 | +2.15 | +6.28 |
| Level | Major | Minor | Intermediate | - | Minor | Intermediate | Major |
Pivot points can also be used to set your price objectives. Here is the price situation in relation to pivot points:
| Pivot points | S3 | S2 | S1 | PP | R1 | R2 | R3 |
|---|---|---|---|---|---|---|---|
| Standard | 196.18 | 197.06 | 198.60 | 199.48 | 201.02 | 201.90 | 203.44 |
| Camarilla | 199.49 | 199.71 | 199.93 | 200.15 | 200.37 | 200.59 | 200.82 |
| Woodie | 196.52 | 197.23 | 198.94 | 199.65 | 201.36 | 202.07 | 203.78 |
| Fibonacci | 197.06 | 197.98 | 198.55 | 199.48 | 200.40 | 200.97 | 201.90 |
| Pivot points | S3 | S2 | S1 | PP | R1 | R2 | R3 |
|---|---|---|---|---|---|---|---|
| Standard | 193.58 | 195.82 | 198.02 | 200.26 | 202.46 | 204.70 | 206.90 |
| Camarilla | 199.00 | 199.41 | 199.81 | 200.22 | 200.63 | 201.03 | 201.44 |
| Woodie | 193.56 | 195.81 | 198.00 | 200.25 | 202.44 | 204.69 | 206.88 |
| Fibonacci | 195.82 | 197.52 | 198.56 | 200.26 | 201.96 | 203.00 | 204.70 |
| Pivot points | S3 | S2 | S1 | PP | R1 | R2 | R3 |
|---|---|---|---|---|---|---|---|
| Standard | 185.49 | 191.77 | 196.00 | 202.28 | 206.51 | 212.79 | 217.02 |
| Camarilla | 197.33 | 198.29 | 199.26 | 200.22 | 201.18 | 202.15 | 203.11 |
| Woodie | 184.46 | 191.26 | 194.97 | 201.77 | 205.48 | 212.28 | 215.99 |
| Fibonacci | 191.77 | 195.79 | 198.27 | 202.28 | 206.30 | 208.78 | 212.79 |
Numerical data
The following is the status of the technical indicators and moving averages at the time of publication of this technical analysis:
| RSI (14): | 55.25 | |
| MACD (12,26,9): | 0.1000 | |
| Directional Movement: | 14.46 | |
| AROON (14): | 28.57 | |
| DEMA (21): | 200.17 | |
| Parabolic SAR (0,02-0,02-0,2): | 199.24 | |
| Elder Ray (13): | 0.61 | |
| Super Trend (3,10): | 198.50 | |
| Zig ZAG (10): | 201.05 | |
| VORTEX (21): | 0.9300 | |
| Stochastique (14,3,5): | 51.47 | |
| TEMA (21): | 200.67 | |
| Williams %R (14): | -46.70 | |
| Chande Momentum Oscillator (20): | 2.68 | |
| Repulse (5,40,3): | 0.3700 | |
| ROCnROLL: | -1 | |
| TRIX (15,9): | -0.0100 | |
| Courbe Coppock: | 0.79 |
| MA7: | 200.59 | |
| MA20: | 203.70 | |
| MA50: | 202.29 | |
| MA100: | 191.84 | |
| MAexp7: | 200.59 | |
| MAexp20: | 200.18 | |
| MAexp50: | 200.78 | |
| MAexp100: | 201.89 | |
| Price / MA7: | +0.47% | |
| Price / MA20: | -1.07% | |
| Price / MA50: | -0.38% | |
| Price / MA100: | +5.05% | |
| Price / MAexp7: | +0.47% | |
| Price / MAexp20: | +0.67% | |
| Price / MAexp50: | +0.37% | |
| Price / MAexp100: | -0.18% |
News
The last news published on CME GROUP INC. at the time of the generation of this analysis was as follows:
- CME Group Inc. Reports First-Quarter 2023 Financial Results
- CME Group Completes Key Milestones in Conversion of Eurodollar Futures, Options and Cleared Swaps to SOFR-Based Derivatives
- CME Group to Expand Bitcoin and Ether Options Expiries on May 22
- Commodity price outlook and interest rate concerns cloud farmer sentiment
- CME Group Reports Second-Highest March and Quarterly ADV on Record
About author
Online


Add a comment
Comments
0 comments on the analysis CME GROUP INC. - 1H