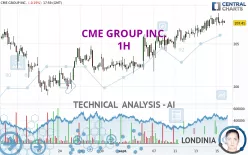
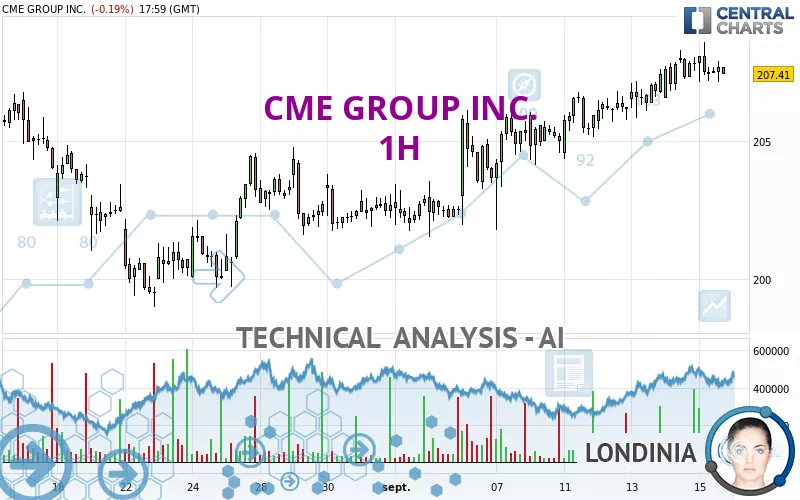
CME GROUP INC. - 1H - Technical analysis published on 09/15/2023 (GMT)
- 282
- 0
Click here for a new analysis!
- Timeframe : 1H
- - Analysis generated on
- Status : LEVEL MAINTAINED
Summary of the analysis

Additional analysis
Quotes
CME GROUP INC. rating 207.70 USD. The price is lower by -0.05% since the last closing and was between 207.12 USD and 208.57 USD. This implies that the price is at +0.28% from its lowest and at -0.42% from its highest.A study of price movements over other periods shows the following variations:
New HIGH record (1 year)
Type : Bullish
Timeframe : Weekly
New HIGH record (1st january)
Type : Bullish
Timeframe : Weekly
New HIGH record (1 month)
Type : Bullish
Timeframe : Weekly
Technical
Technical analysis of CME GROUP INC. in 1H shows a strongly overall bullish trend. 92.86% of the signals given by moving averages are bullish. The overall trend is supported by the strong bullish signals from short-term moving averages. There is no crossing of moving average by the price or crossing of moving averages between themselves.
An assessment of technical indicators shows a slightly bullish signal.
Central Indicators, the detector scanner for these technical indicators has recently detected several signals:
Pivot points : price is over resistance 1
Type : Neutral
Timeframe : Weekly
Parabolic SAR indicator bearish reversal
Type : Bearish
Timeframe : 1 hour
Price is back over the pivot point
Type : Bullish
Timeframe : 1 hour
Williams %R indicator is back over -50
Type : Bullish
Timeframe : 1 hour
Central Patterns, the market scanner focusing on chart patterns, resistances and supports found this result:
Near horizontal resistance
Type : Bearish
Timeframe : 1 hour
The Central Candlesticks scanner, specialised in Japanese candlesticks, did not identify any signals.
| S3 | S2 | S1 | Price | R1 | R2 | |
|---|---|---|---|---|---|---|
| ProTrendLines | 197.93 | 200.46 | 203.68 | 207.70 | 207.79 | 236.26 |
| Change (%) | -4.70% | -3.49% | -1.94% | - | +0.04% | +13.75% |
| Change | -9.77 | -7.24 | -4.02 | - | +0.09 | +28.56 |
| Level | Minor | Intermediate | Intermediate | - | Major | Major |
Pivot points can also be used to set your price objectives. Here is the price situation in relation to pivot points:
| Pivot points | S3 | S2 | S1 | PP | R1 | R2 | R3 |
|---|---|---|---|---|---|---|---|
| Standard | 205.08 | 205.82 | 206.81 | 207.55 | 208.54 | 209.28 | 210.27 |
| Camarilla | 207.33 | 207.49 | 207.65 | 207.81 | 207.97 | 208.13 | 208.29 |
| Woodie | 205.22 | 205.88 | 206.95 | 207.61 | 208.68 | 209.34 | 210.41 |
| Fibonacci | 205.82 | 206.48 | 206.89 | 207.55 | 208.21 | 208.62 | 209.28 |
| Pivot points | S3 | S2 | S1 | PP | R1 | R2 | R3 |
|---|---|---|---|---|---|---|---|
| Standard | 195.63 | 198.03 | 201.51 | 203.91 | 207.39 | 209.79 | 213.27 |
| Camarilla | 203.37 | 203.91 | 204.45 | 204.99 | 205.53 | 206.07 | 206.61 |
| Woodie | 196.17 | 198.30 | 202.05 | 204.18 | 207.93 | 210.06 | 213.81 |
| Fibonacci | 198.03 | 200.28 | 201.66 | 203.91 | 206.16 | 207.54 | 209.79 |
| Pivot points | S3 | S2 | S1 | PP | R1 | R2 | R3 |
|---|---|---|---|---|---|---|---|
| Standard | 185.05 | 191.00 | 196.29 | 202.24 | 207.53 | 213.48 | 218.77 |
| Camarilla | 198.50 | 199.53 | 200.56 | 201.59 | 202.62 | 203.65 | 204.68 |
| Woodie | 184.73 | 190.84 | 195.97 | 202.08 | 207.21 | 213.32 | 218.45 |
| Fibonacci | 191.00 | 195.29 | 197.94 | 202.24 | 206.53 | 209.18 | 213.48 |
Numerical data
The following are the details of the technical indicators and moving averages that were collected to generate this technical analysis:
| RSI (14): | 59.18 | |
| MACD (12,26,9): | 0.5000 | |
| Directional Movement: | 1.91 | |
| AROON (14): | 78.57 | |
| DEMA (21): | 207.96 | |
| Parabolic SAR (0,02-0,02-0,2): | 208.57 | |
| Elder Ray (13): | 0 | |
| Super Trend (3,10): | 205.63 | |
| Zig ZAG (10): | 207.84 | |
| VORTEX (21): | 1.0600 | |
| Stochastique (14,3,5): | 57.12 | |
| TEMA (21): | 207.85 | |
| Williams %R (14): | -37.87 | |
| Chande Momentum Oscillator (20): | 0.38 | |
| Repulse (5,40,3): | 0.2200 | |
| ROCnROLL: | 1 | |
| TRIX (15,9): | 0.0400 | |
| Courbe Coppock: | 0.89 |
| MA7: | 206.48 | |
| MA20: | 203.06 | |
| MA50: | 197.98 | |
| MA100: | 189.53 | |
| MAexp7: | 207.62 | |
| MAexp20: | 207.23 | |
| MAexp50: | 206.04 | |
| MAexp100: | 204.67 | |
| Price / MA7: | +0.59% | |
| Price / MA20: | +2.29% | |
| Price / MA50: | +4.91% | |
| Price / MA100: | +9.59% | |
| Price / MAexp7: | +0.04% | |
| Price / MAexp20: | +0.23% | |
| Price / MAexp50: | +0.81% | |
| Price / MAexp100: | +1.48% |
News
Don't forget to follow the news on CME GROUP INC.. At the time of publication of this analysis, the latest news was as follows:
- CME Group Inc. Reports First-Quarter 2023 Financial Results
- CME Group Completes Key Milestones in Conversion of Eurodollar Futures, Options and Cleared Swaps to SOFR-Based Derivatives
- CME Group to Expand Bitcoin and Ether Options Expiries on May 22
- Commodity price outlook and interest rate concerns cloud farmer sentiment
- CME Group Reports Second-Highest March and Quarterly ADV on Record
About author
Online


Add a comment
Comments
0 comments on the analysis CME GROUP INC. - 1H