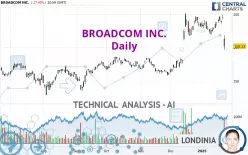
BROADCOM INC. - Daily - Technical analysis published on 01/27/2025 (GMT)
- 210
- 0
Click here for a new analysis!
- Timeframe : Daily
- - Analysis generated on
- Status : INVALID

Summary of the analysis

Additional analysis
Quotes
BROADCOM INC. rating 202.13 USD. The price registered a decrease of -17.40% on the session with the lowest point at 196.23 USD and the highest point at 218.43 USD. The deviation from the price is +3.01% for the low point and -7.46% for the high point.The Central Gaps scanner detects the formation of a bearish gap marking the strong presence of sellers ahead of buyers at the opening. This formed a quotation gap.
Opening Gap DOWN
Type : Bearish
Timeframe : Openning
So that you have an overall view of the price change, here is a table showing the variations over several periods:
New LOW record (1st january)
Type : Bearish
Timeframe : Weekly
New LOW record (1 month)
Type : Bearish
Timeframe : Weekly
Technical
Technical analysis of BROADCOM INC. in Daily shows an overall slightly bullish trend. 57.14% of the signals given by moving averages are bullish. Caution: the strong bearish signals currently being given by short-term moving averages indicate that this slightly bullish trend could be reversed. An assessment of moving averages reveals several bearish signals that could impact this trend:
Bearish price crossover with Moving Average 20
Type : Bearish
Timeframe : Daily
Bearish price crossover with Moving Average 50
Type : Bearish
Timeframe : Daily
Bearish price crossover with adaptative moving average 20
Type : Bearish
Timeframe : Daily
Bearish price crossover with adaptative moving average 50
Type : Bearish
Timeframe : Daily
Bearish price crossover with adaptative moving average 100
Type : Bearish
Timeframe : Daily
An assessment of technical indicators shows a bearish signal.
Caution: the Central Indicators scanner currently detects an excess:
CCI indicator is oversold : under -100
Type : Neutral
Timeframe : Daily
MACD indicator: bearish divergence
Type : Bearish
Timeframe : Daily
Williams %R indicator is oversold : under -80
Type : Neutral
Timeframe : Daily
Pivot points : price is under support 3
Type : Neutral
Timeframe : Daily
Pivot points : price is under support 3
Type : Neutral
Timeframe : Weekly
RSI indicator is back under 50
Type : Bearish
Timeframe : Daily
Parabolic SAR indicator bearish reversal
Type : Bearish
Timeframe : Daily
Ichimoku : price is under the cloud
Type : Bearish
Timeframe : Daily
SuperTrend indicator bearish reversal
Type : Bearish
Timeframe : Daily
Momentum indicator is back under 0
Type : Bearish
Timeframe : Daily
Central Patterns, the market scanner focusing on chart patterns, resistances and supports found these results:
Horizontal support is broken
Type : Bearish
Timeframe : Daily
Support of channel is broken
Type : Bearish
Timeframe : Daily
For a small setback in the very short term, the Central Candlesticks scanner currently notes the presence of this bearish pattern in Japanese candlesticks:
Black evening star
Type : Bearish
Timeframe : Daily
Abandoned baby evening star
Type : Bearish
Timeframe : Daily
| S3 | S2 | S1 | Price | R1 | R2 | |
|---|---|---|---|---|---|---|
| ProTrendLines | 135.70 | 159.24 | 181.22 | 202.13 | 236.41 | 249.33 |
| Change (%) | -32.86% | -21.22% | -10.34% | - | +16.96% | +23.35% |
| Change | -66.43 | -42.89 | -20.91 | - | +34.28 | +47.20 |
| Level | Intermediate | Major | Major | - | Major | Major |
Pivot points can also be used to set your price objectives. Here is the price situation in relation to pivot points:
| Pivot points | S3 | S2 | S1 | PP | R1 | R2 | R3 |
|---|---|---|---|---|---|---|---|
| Standard | 170.56 | 183.40 | 192.76 | 205.60 | 214.96 | 227.80 | 237.16 |
| Camarilla | 196.03 | 198.06 | 200.10 | 202.13 | 204.17 | 206.20 | 208.24 |
| Woodie | 168.83 | 182.53 | 191.03 | 204.73 | 213.23 | 226.93 | 235.43 |
| Fibonacci | 183.40 | 191.88 | 197.12 | 205.60 | 214.08 | 219.32 | 227.80 |
| Pivot points | S3 | S2 | S1 | PP | R1 | R2 | R3 |
|---|---|---|---|---|---|---|---|
| Standard | 223.88 | 230.00 | 237.35 | 243.47 | 250.82 | 256.94 | 264.29 |
| Camarilla | 241.00 | 242.23 | 243.47 | 244.70 | 245.94 | 247.17 | 248.40 |
| Woodie | 224.50 | 230.31 | 237.97 | 243.78 | 251.44 | 257.25 | 264.91 |
| Fibonacci | 230.00 | 235.15 | 238.32 | 243.47 | 248.62 | 251.79 | 256.94 |
| Pivot points | S3 | S2 | S1 | PP | R1 | R2 | R3 |
|---|---|---|---|---|---|---|---|
| Standard | 90.15 | 126.23 | 179.04 | 215.12 | 267.93 | 304.01 | 356.82 |
| Camarilla | 207.40 | 215.54 | 223.69 | 231.84 | 239.99 | 248.14 | 256.29 |
| Woodie | 98.51 | 130.41 | 187.40 | 219.30 | 276.29 | 308.19 | 365.18 |
| Fibonacci | 126.23 | 160.19 | 181.17 | 215.12 | 249.08 | 270.06 | 304.01 |
Numerical data
The following is the status of the technical indicators and moving averages at the time of publication of this technical analysis:
| RSI (14): | 37.90 | |
| MACD (12,26,9): | 5.6600 | |
| Directional Movement: | -13.28 | |
| AROON (14): | -7.14 | |
| DEMA (21): | 237.29 | |
| Parabolic SAR (0,02-0,02-0,2): | 249.59 | |
| Elder Ray (13): | -22.85 | |
| Super Trend (3,10): | 244.67 | |
| Zig ZAG (10): | 202.13 | |
| VORTEX (21): | 0.8900 | |
| Stochastique (14,3,5): | 56.79 | |
| TEMA (21): | 233.01 | |
| Williams %R (14): | -88.94 | |
| Chande Momentum Oscillator (20): | -26.51 | |
| Repulse (5,40,3): | -8.1100 | |
| ROCnROLL: | 2 | |
| TRIX (15,9): | 0.6200 | |
| Courbe Coppock: | 1.91 |
| MA7: | 233.60 | |
| MA20: | 232.54 | |
| MA50: | 204.31 | |
| MA100: | 187.41 | |
| MAexp7: | 229.32 | |
| MAexp20: | 227.81 | |
| MAexp50: | 211.84 | |
| MAexp100: | 194.20 | |
| Price / MA7: | -13.47% | |
| Price / MA20: | -13.08% | |
| Price / MA50: | -1.07% | |
| Price / MA100: | +7.85% | |
| Price / MAexp7: | -11.86% | |
| Price / MAexp20: | -11.27% | |
| Price / MAexp50: | -4.58% | |
| Price / MAexp100: | +4.08% |
News
Don't forget to follow the news on BROADCOM INC.. At the time of publication of this analysis, the latest news was as follows:
- Broadcom Inc. Announces Pricing and Upsizing of Mandatory Convertible Preferred Stock Offering
- Broadcom Inc. Announces Offering of Mandatory Convertible Preferred Stock
-
 Jim Cramer Breaks Down Broadcom, U.S.-China Trade War, Markets
- Broadcom Inc. Announces Third Quarter Fiscal Year 2019 Financial Results and Quarterly Dividend
- Broadcom Unveils Portfolio for RDK Video Accelerator Program
About author

Online


Add a comment
Comments
0 comments on the analysis BROADCOM INC. - Daily