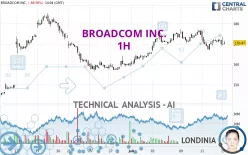
BROADCOM INC. - 1H - Technical analysis published on 07/15/2024 (GMT)
- 113
- 0
- Timeframe : 1H
- - Analysis generated on
- Status : NEUTRAL

Summary of the analysis

Additional analysis
Quotes
BROADCOM INC. rating 171.00 USD. The price is lower by -89.95% since the last closing with the lowest point at 169.26 USD and the highest point at 173.50 USD. The deviation from the price is +1.03% for the low point and -1.44% for the high point.The Central Gaps scanner detects a bearish opening marking the presence of sellers ahead of buyers at the opening but not sufficiently marked to allow the price to register a quotation gap.
Bearish opening
Type : Bearish
Timeframe : Openning
So that you have an overall view of the price change, here is a table showing the variations over several periods:
Technical
A technical analysis in 1H of this BROADCOM INC. chart shows a slightly bullish trend. Only 57.14% of the signals given by moving averages are bullish. This slightly bullish trend could turn neutral or reverse given the slightly bearish signals currently being given by short-term moving averages. The Central Indicators scanner detects bearish signals on moving averages that could impact this trend:
Bearish trend reversal : adaptative moving average 20
Type : Bearish
Timeframe : 1 hour
Bearish trend reversal : adaptative moving average 50
Type : Bearish
Timeframe : 1 hour
Moving Average bearish crossovers : MA20 & MA50
Type : Bearish
Timeframe : 1 hour
In fact, Central Analyzer took into account 18 technical indicators and the result was as follows: 6 are bullish, 7 are neutral and 5 are bearish. Other results related to technical indicators were also found by the Central Indicators scanner:
Price is back over the pivot point
Type : Bullish
Timeframe : 1 hour
Momentum indicator is back over 0
Type : Bullish
Timeframe : 1 hour
Williams %R indicator is back over -50
Type : Bullish
Timeframe : 1 hour
Central Patterns, the market scanner focusing on chart patterns, resistances and supports found this result:
Near resistance of channel
Type : Bearish
Timeframe : 1 hour
No result was found by the Central Candlesticks scanner on Japanese candlesticks.
| S3 | S2 | S1 | Price | R1 | R2 | |
|---|---|---|---|---|---|---|
| ProTrendLines | 139.66 | 158.08 | 166.90 | 171.00 | 174.59 | 182.31 |
| Change (%) | -18.33% | -7.56% | -2.40% | - | +2.10% | +6.61% |
| Change | -31.34 | -12.92 | -4.10 | - | +3.59 | +11.31 |
| Level | Major | Major | Intermediate | - | Intermediate | Major |
Attention could also be paid to pivot points to set price objectives:
| Pivot points | S3 | S2 | S1 | PP | R1 | R2 | R3 |
|---|---|---|---|---|---|---|---|
| Standard | 165.14 | 167.14 | 168.60 | 170.60 | 172.06 | 174.06 | 175.52 |
| Camarilla | 169.12 | 169.44 | 169.75 | 170.07 | 170.39 | 170.70 | 171.02 |
| Woodie | 164.88 | 167.01 | 168.34 | 170.47 | 171.80 | 173.93 | 175.26 |
| Fibonacci | 167.14 | 168.46 | 169.28 | 170.60 | 171.92 | 172.74 | 174.06 |
| Pivot points | S3 | S2 | S1 | PP | R1 | R2 | R3 |
|---|---|---|---|---|---|---|---|
| Standard | 155.33 | 161.09 | 165.58 | 171.34 | 175.83 | 181.59 | 186.08 |
| Camarilla | 167.25 | 168.19 | 169.13 | 170.07 | 171.01 | 171.95 | 172.89 |
| Woodie | 154.70 | 160.77 | 164.95 | 171.02 | 175.20 | 181.27 | 185.45 |
| Fibonacci | 161.09 | 165.01 | 167.43 | 171.34 | 175.26 | 177.68 | 181.59 |
| Pivot points | S3 | S2 | S1 | PP | R1 | R2 | R3 |
|---|---|---|---|---|---|---|---|
| Standard | 77.33 | 103.58 | 132.07 | 158.32 | 186.81 | 213.06 | 241.55 |
| Camarilla | 145.50 | 150.51 | 155.53 | 160.55 | 165.57 | 170.59 | 175.60 |
| Woodie | 78.44 | 104.14 | 133.18 | 158.88 | 187.92 | 213.62 | 242.66 |
| Fibonacci | 103.58 | 124.49 | 137.41 | 158.32 | 179.23 | 192.15 | 213.06 |
Numerical data
The following is the status of technical indicators and moving averages registered at the time this technical analysis was created:
| RSI (14): | 43.56 | |
| MACD (12,26,9): | -0.2700 | |
| Directional Movement: | -3.66 | |
| AROON (14): | -35.71 | |
| DEMA (21): | 171.24 | |
| Parabolic SAR (0,02-0,02-0,2): | 167.71 | |
| Elder Ray (13): | 0.27 | |
| Super Trend (3,10): | 174.84 | |
| Zig ZAG (10): | 169.59 | |
| VORTEX (21): | 0.9200 | |
| Stochastique (14,3,5): | 47.13 | |
| TEMA (21): | 170.20 | |
| Williams %R (14): | -54.44 | |
| Chande Momentum Oscillator (20): | 0.33 | |
| Repulse (5,40,3): | -1.6400 | |
| ROCnROLL: | -1 | |
| TRIX (15,9): | -0.0200 | |
| Courbe Coppock: | 2.66 |
| MA7: | 171.91 | |
| MA20: | 168.79 | |
| MA50: | 150.26 | |
| MA100: | 140.23 | |
| MAexp7: | 170.67 | |
| MAexp20: | 171.39 | |
| MAexp50: | 170.54 | |
| MAexp100: | 167.64 | |
| Price / MA7: | -0.53% | |
| Price / MA20: | +1.31% | |
| Price / MA50: | +13.80% | |
| Price / MA100: | +21.94% | |
| Price / MAexp7: | +0.19% | |
| Price / MAexp20: | -0.23% | |
| Price / MAexp50: | +0.27% | |
| Price / MAexp100: | +2.00% |
News
The latest news and videos published on BROADCOM INC. at the time of the analysis were as follows:
- Broadcom Inc. Announces Pricing and Upsizing of Mandatory Convertible Preferred Stock Offering
- Broadcom Inc. Announces Offering of Mandatory Convertible Preferred Stock
-
 Jim Cramer Breaks Down Broadcom, U.S.-China Trade War, Markets
- Broadcom Inc. Announces Third Quarter Fiscal Year 2019 Financial Results and Quarterly Dividend
- Broadcom Unveils Portfolio for RDK Video Accelerator Program
About author

Online


Add a comment
Comments
0 comments on the analysis BROADCOM INC. - 1H