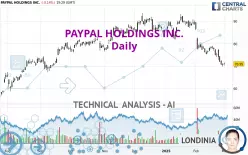
PAYPAL HOLDINGS INC. - Daily - Technical analysis published on 03/03/2025 (GMT)
- 175
- 0
Click here for a new analysis!
- Timeframe : Daily
- - Analysis generated on
- Status : TARGET REACHED

Summary of the analysis

Additional analysis
Quotes
PAYPAL HOLDINGS INC. rating 70.95 USD. The price is lower by -0.14% since the last closing and was traded between 70.26 USD and 71.57 USD over the period. The price is currently at +0.98% from its lowest and -0.87% from its highest.The Central Gaps scanner detects a bullish opening. A small advantage for buyers in the very short term.
Bullish opening
Type : Bullish
Timeframe : Openning
A study of price movements over other periods shows the following variations:
Near a new LOW record (1st january)
Type : Bearish
Timeframe : Weekly
Near a new LOW record (1 month)
Type : Bearish
Timeframe : Weekly
Technical
Technical analysis of PAYPAL HOLDINGS INC. in Daily shows a overall strongly bearish trend. The signals given by moving averages are 89.29% bearish. This strong bearish trend is confirmed by the strong signals currently being given by short-term moving averages. The Central Indicators scanner detects a bearish signal on moving averages that could impact this trend:
Moving Average bearish crossovers : MA50 & MA100
Type : Bearish
Timeframe : Daily
The probability of a further decline is moderate given the direction of the technical indicators.
But beware of excesses. The Central Indicators scanner currently detects this:
RSI indicator is oversold : under 30
Type : Neutral
Timeframe : Daily
CCI indicator is oversold : under -100
Type : Neutral
Timeframe : Daily
CCI indicator: bullish divergence
Type : Bullish
Timeframe : Daily
Williams %R indicator is oversold : under -80
Type : Neutral
Timeframe : Daily
An analysis of the price chart with the Central Patterns scanner (detector of chart patterns and resistances and supports) shows a result that can have an impact on the price change:
Near support of channel
Type : Bullish
Timeframe : Daily
The Central Candlesticks scanner, specialised in Japanese candlesticks, did not identify any signals.
| S3 | S2 | S1 | Price | R1 | R2 | R3 | |
|---|---|---|---|---|---|---|---|
| ProTrendLines | 57.22 | 61.81 | 68.85 | 70.95 | 73.16 | 77.26 | 85.30 |
| Change (%) | -19.35% | -12.88% | -2.96% | - | +3.11% | +8.89% | +20.23% |
| Change | -13.73 | -9.14 | -2.10 | - | +2.21 | +6.31 | +14.35 |
| Level | Intermediate | Minor | Minor | - | Minor | Major | Major |
Pivot points can also be used to set your price objectives. Here is the price situation in relation to pivot points:
| Pivot points | S3 | S2 | S1 | PP | R1 | R2 | R3 |
|---|---|---|---|---|---|---|---|
| Standard | 68.67 | 69.18 | 70.11 | 70.62 | 71.55 | 72.06 | 72.99 |
| Camarilla | 70.65 | 70.79 | 70.92 | 71.05 | 71.18 | 71.31 | 71.45 |
| Woodie | 68.89 | 69.29 | 70.33 | 70.73 | 71.77 | 72.17 | 73.21 |
| Fibonacci | 69.18 | 69.73 | 70.07 | 70.62 | 71.17 | 71.51 | 72.06 |
| Pivot points | S3 | S2 | S1 | PP | R1 | R2 | R3 |
|---|---|---|---|---|---|---|---|
| Standard | 60.07 | 64.88 | 67.96 | 72.77 | 75.85 | 80.66 | 83.74 |
| Camarilla | 68.88 | 69.60 | 70.33 | 71.05 | 71.77 | 72.50 | 73.22 |
| Woodie | 59.22 | 64.45 | 67.11 | 72.34 | 75.00 | 80.23 | 82.89 |
| Fibonacci | 64.88 | 67.89 | 69.75 | 72.77 | 75.78 | 77.64 | 80.66 |
| Pivot points | S3 | S2 | S1 | PP | R1 | R2 | R3 |
|---|---|---|---|---|---|---|---|
| Standard | 43.89 | 56.78 | 63.92 | 76.81 | 83.95 | 96.84 | 103.98 |
| Camarilla | 65.54 | 67.38 | 69.21 | 71.05 | 72.89 | 74.72 | 76.56 |
| Woodie | 41.01 | 55.34 | 61.04 | 75.37 | 81.07 | 95.40 | 101.10 |
| Fibonacci | 56.78 | 64.44 | 69.16 | 76.81 | 84.47 | 89.19 | 96.84 |
Numerical data
The following are the details of the technical indicators and moving averages that were collected to generate this technical analysis:
| RSI (14): | 27.62 | |
| MACD (12,26,9): | -3.6300 | |
| Directional Movement: | -18.08 | |
| AROON (14): | -50.00 | |
| DEMA (21): | 72.11 | |
| Parabolic SAR (0,02-0,02-0,2): | 75.04 | |
| Elder Ray (13): | -3.80 | |
| Super Trend (3,10): | 77.43 | |
| Zig ZAG (10): | 71.10 | |
| VORTEX (21): | 0.6300 | |
| Stochastique (14,3,5): | 10.65 | |
| TEMA (21): | 70.29 | |
| Williams %R (14): | -84.28 | |
| Chande Momentum Oscillator (20): | -5.17 | |
| Repulse (5,40,3): | -2.2700 | |
| ROCnROLL: | 2 | |
| TRIX (15,9): | -0.5700 | |
| Courbe Coppock: | 16.37 |
| MA7: | 72.74 | |
| MA20: | 76.57 | |
| MA50: | 83.41 | |
| MA100: | 83.69 | |
| MAexp7: | 72.74 | |
| MAexp20: | 76.68 | |
| MAexp50: | 80.84 | |
| MAexp100: | 80.78 | |
| Price / MA7: | -2.46% | |
| Price / MA20: | -7.34% | |
| Price / MA50: | -14.94% | |
| Price / MA100: | -15.22% | |
| Price / MAexp7: | -2.46% | |
| Price / MAexp20: | -7.47% | |
| Price / MAexp50: | -12.23% | |
| Price / MAexp100: | -12.17% |
News
The latest news and videos published on PAYPAL HOLDINGS INC. at the time of the analysis were as follows:
- PayPal Introduces Outlook for Accelerating Growth at Investor Day
- Cruise into Convenience: Norwegian Cruise Line Holdings expands strategic collaboration with PayPal
- PayPal Reports Fourth Quarter and Full Year 2024 Results
- PAYPAL INVESTOR REMINDER: Scott+Scott Attorneys at Law LLP Investigates PayPal Holdings, Inc.’s Directors and Officers for Breach of Fiduciary Duties – PYPL
- PAYPAL INVESTOR ALERT: Scott+Scott Attorneys at Law LLP Investigates PayPal Holdings, Inc.’s Directors and Officers for Breach of Fiduciary Duties – PYPL
About author
Online


Add a comment
Comments
0 comments on the analysis PAYPAL HOLDINGS INC. - Daily