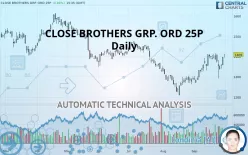
CLOSE BROTHERS GRP. ORD 25P - Daily - Technical analysis published on 09/30/2019 (GMT)
- 260
- 0
- Who voted?
Click here for a new analysis!
- Timeframe : Daily
- - Analysis generated on
- Status : INVALID

Summary of the analysis

Additional analysis
Quotes
The CLOSE BROTHERS GRP. ORD 25P price is 1,409 GBX. The price has increased by +0.86% since the last closing with the lowest point at 1,394 GBX and the highest point at 1,410 GBX. The deviation from the price is +1.08% for the low point and -0.07% for the high point.A bullish gap was detected at the opening by the Central Gaps scanner. There are a lot of buyers and they have the upper hand in the very short term.
Opening Gap UP
Type : Bullish
Timeframe : Openning
Here is a more detailed summary of the historical variations registered by CLOSE BROTHERS GRP. ORD 25P:
Near a new HIGH record (1 month)
Type : Bullish
Timeframe : Weekly
Technical
A technical analysis in Daily of this CLOSE BROTHERS GRP. ORD 25P chart shows a bullish trend. 67.86% of the signals given by moving averages are bullish. This bullish trend is supported by the strong bullish signals given by short-term moving averages. An assessment of moving averages reveals several bullish signals that could impact this trend:
Bullish trend reversal : adaptative moving average 100
Type : Bullish
Timeframe : Daily
Bullish price crossover with Moving Average 100
Type : Bullish
Timeframe : Daily
Bullish price crossover with adaptative moving average 20
Type : Bullish
Timeframe : Daily
Bullish price crossover with adaptative moving average 100
Type : Bullish
Timeframe : Daily
The probability of a further increase are moderate given the direction of the technical indicators.
Caution: the Central Indicators scanner currently detects an excess:
Williams %R indicator is overbought : over -20
Type : Neutral
Timeframe : Daily
Price is back over the pivot point
Type : Bullish
Timeframe : Daily
Momentum indicator is back over 0
Type : Bullish
Timeframe : Daily
An analysis of the price chart with the Central Patterns scanner (detector of chart patterns and resistances and supports) shows several results that can have an impact on the price change:
Near horizontal resistance
Type : Bearish
Timeframe : Daily
Near resistance of channel
Type : Bearish
Timeframe : Daily
Near resistance of triangle
Type : Bearish
Timeframe : Daily
No result was found by the Central Candlesticks scanner on Japanese candlesticks.
| S3 | S2 | S1 | Price | R1 | R2 | R3 | |
|---|---|---|---|---|---|---|---|
| ProTrendLines | 1,272 | 1,316 | 1,401 | 1,409 | 1,470 | 1,524 | 1,569 |
| Change (%) | -9.72% | -6.60% | -0.57% | - | +4.33% | +8.16% | +11.36% |
| Change | -137 | -93 | -8 | - | +61 | +115 | +160 |
| Level | Intermediate | Intermediate | Major | - | Intermediate | Minor | Minor |
Attention could also be paid to pivot points to set price objectives:
| Pivot points | S3 | S2 | S1 | PP | R1 | R2 | R3 |
|---|---|---|---|---|---|---|---|
| Standard | 1,332 | 1,345 | 1,371 | 1,384 | 1,410 | 1,423 | 1,449 |
| Camarilla | 1,386 | 1,390 | 1,393 | 1,397 | 1,401 | 1,404 | 1,408 |
| Woodie | 1,339 | 1,348 | 1,378 | 1,387 | 1,417 | 1,426 | 1,456 |
| Fibonacci | 1,345 | 1,360 | 1,369 | 1,384 | 1,399 | 1,408 | 1,423 |
| Pivot points | S3 | S2 | S1 | PP | R1 | R2 | R3 |
|---|---|---|---|---|---|---|---|
| Standard | 1,206 | 1,249 | 1,323 | 1,366 | 1,440 | 1,483 | 1,557 |
| Camarilla | 1,365 | 1,376 | 1,386 | 1,397 | 1,408 | 1,418 | 1,429 |
| Woodie | 1,222 | 1,257 | 1,339 | 1,374 | 1,456 | 1,491 | 1,573 |
| Fibonacci | 1,249 | 1,294 | 1,321 | 1,366 | 1,411 | 1,438 | 1,483 |
| Pivot points | S3 | S2 | S1 | PP | R1 | R2 | R3 |
|---|---|---|---|---|---|---|---|
| Standard | 1,073 | 1,141 | 1,215 | 1,283 | 1,357 | 1,425 | 1,499 |
| Camarilla | 1,250 | 1,263 | 1,276 | 1,289 | 1,302 | 1,315 | 1,328 |
| Woodie | 1,076 | 1,143 | 1,218 | 1,285 | 1,360 | 1,427 | 1,502 |
| Fibonacci | 1,141 | 1,195 | 1,229 | 1,283 | 1,337 | 1,371 | 1,425 |
Numerical data
The following are the details of the technical indicators and moving averages that were collected to generate this technical analysis:
| RSI (14): | 63.00 | |
| MACD (12,26,9): | 18.0000 | |
| Directional Movement: | 3 | |
| AROON (14): | -14 | |
| DEMA (21): | 1,388 | |
| Parabolic SAR (0,02-0,02-0,2): | 1,292 | |
| Elder Ray (13): | 27 | |
| Super Trend (3,10): | 1,319 | |
| Zig ZAG (10): | 1,409 | |
| VORTEX (21): | 1.0000 | |
| Stochastique (14,3,5): | 77.00 | |
| TEMA (21): | 1,404 | |
| Williams %R (14): | -6.00 | |
| Chande Momentum Oscillator (20): | 47 | |
| Repulse (5,40,3): | 4.0000 | |
| ROCnROLL: | 1 | |
| TRIX (15,9): | 0.0000 | |
| Courbe Coppock: | 7.00 |
| MA7: | 1,379 | |
| MA20: | 1,365 | |
| MA50: | 1,327 | |
| MA100: | 1,381 | |
| MAexp7: | 1,384 | |
| MAexp20: | 1,365 | |
| MAexp50: | 1,356 | |
| MAexp100: | 1,380 | |
| Price / MA7: | +2.18% | |
| Price / MA20: | +3.22% | |
| Price / MA50: | +6.18% | |
| Price / MA100: | +2.03% | |
| Price / MAexp7: | +1.81% | |
| Price / MAexp20: | +3.22% | |
| Price / MAexp50: | +3.91% | |
| Price / MAexp100: | +2.10% |
News
Don"t forget to follow the news on CLOSE BROTHERS GRP. ORD 25P. At the time of publication of this analysis, the latest news was as follows:
- Klarna Grows Again, Acquiring Close Brothers Retail Finance to Strengthen Position in UK Market
-
 Close Brothers Group
-
Close Brothers Group
About author

Online


Add a comment
Comments
0 comments on the analysis CLOSE BROTHERS GRP. ORD 25P - Daily