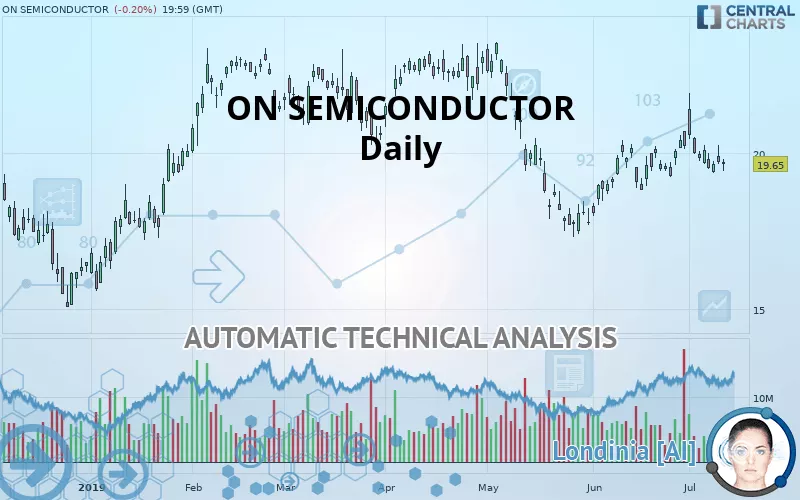
ON SEMICONDUCTOR - Daily - Technical analysis published on 07/12/2019 (GMT)
- 407
- 0
- Who voted?
Click here for a new analysis!
- Timeframe : Daily
- - Analysis generated on
- Status : INVALID
Summary of the analysis

Additional analysis
Quotes
ON SEMICONDUCTOR rating 19.65 USD. On the day, this instrument lost -0.20% with the lowest point at 19.40 USD and the highest point at 19.78 USD. The deviation from the price is +1.29% for the low point and -0.66% for the high point.A study of price movements over other periods shows the following variations:
Near a new LOW record (1 month)
Type : Bearish
Timeframe : Weekly
Technical
A technical analysis in Daily of this ON SEMICONDUCTOR chart shows a sharp bearish trend. 92.86% of the signals given by moving averages are bearish. The overall trend is supported by the strong bearish signals from short-term moving averages. The Central Indicators scanner does not detect any result on moving averages that would impact this trend.
An assessment of technical indicators does not currently provide any relevant information on the direction of future price movements.
But beware of excesses. The Central Indicators scanner currently detects this:
Williams %R indicator is oversold : under -80
Type : Neutral
Timeframe : Daily
MACD crosses DOWN its Moving Average
Type : Bearish
Timeframe : Daily
Price is back under the pivot point
Type : Bearish
Timeframe : Daily
Price is back under the pivot point
Type : Bearish
Timeframe : Weekly
Momentum indicator is back over 0
Type : Bullish
Timeframe : Daily
The analysis of the price chart with Central Patterns scanners does not return any result.
The Central Candlesticks scanner which studies Japanese candlesticks did not detect anything.
| S3 | S2 | S1 | Price | R1 | R2 | R3 | |
|---|---|---|---|---|---|---|---|
| ProTrendLines | 16.83 | 17.68 | 19.33 | 19.65 | 20.55 | 21.33 | 23.52 |
| Change (%) | -14.35% | -10.03% | -1.63% | - | +4.58% | +8.55% | +19.69% |
| Change | -2.82 | -1.97 | -0.32 | - | +0.90 | +1.68 | +3.87 |
| Level | Minor | Major | Major | - | Intermediate | Minor | Intermediate |
Pivot points can also be used to set your price objectives. Here is the price situation in relation to pivot points:
| Pivot points | S3 | S2 | S1 | PP | R1 | R2 | R3 |
|---|---|---|---|---|---|---|---|
| Standard | 18.90 | 19.27 | 19.48 | 19.86 | 20.07 | 20.44 | 20.65 |
| Camarilla | 19.53 | 19.58 | 19.64 | 19.69 | 19.74 | 19.80 | 19.85 |
| Woodie | 18.81 | 19.23 | 19.40 | 19.81 | 19.98 | 20.40 | 20.57 |
| Fibonacci | 19.27 | 19.49 | 19.63 | 19.86 | 20.08 | 20.22 | 20.44 |
| Pivot points | S3 | S2 | S1 | PP | R1 | R2 | R3 |
|---|---|---|---|---|---|---|---|
| Standard | 16.88 | 18.25 | 19.16 | 20.53 | 21.44 | 22.81 | 23.72 |
| Camarilla | 19.44 | 19.65 | 19.86 | 20.07 | 20.28 | 20.49 | 20.70 |
| Woodie | 16.65 | 18.14 | 18.93 | 20.42 | 21.21 | 22.70 | 23.49 |
| Fibonacci | 18.25 | 19.12 | 19.66 | 20.53 | 21.40 | 21.94 | 22.81 |
Numerical data
The following are the details of the technical indicators and moving averages that were collected to generate this technical analysis:
| RSI (14): | 49.00 | |
| MACD (12,26,9): | 0.0400 | |
| Directional Movement: | 9.64 | |
| AROON (14): | 28.57 | |
| DEMA (21): | 19.76 | |
| Parabolic SAR (0,02-0,02-0,2): | 21.66 | |
| Elder Ray (13): | -0.17 | |
| Super Trend (3,10): | 18.96 | |
| Zig ZAG (10): | 19.65 | |
| VORTEX (21): | 0.8500 | |
| Stochastique (14,3,5): | 16.42 | |
| TEMA (21): | 19.98 | |
| Williams %R (14): | -83.96 | |
| Chande Momentum Oscillator (20): | 0.19 | |
| Repulse (5,40,3): | -1.8400 | |
| ROCnROLL: | 2 | |
| TRIX (15,9): | 0.0600 | |
| Courbe Coppock: | 2.92 |
| MA7: | 19.77 | |
| MA20: | 19.74 | |
| MA50: | 19.75 | |
| MA100: | 20.94 | |
| MAexp7: | 19.76 | |
| MAexp20: | 19.73 | |
| MAexp50: | 19.94 | |
| MAexp100: | 20.18 | |
| Price / MA7: | -0.61% | |
| Price / MA20: | -0.46% | |
| Price / MA50: | -0.51% | |
| Price / MA100: | -6.16% | |
| Price / MAexp7: | -0.56% | |
| Price / MAexp20: | -0.41% | |
| Price / MAexp50: | -1.45% | |
| Price / MAexp100: | -2.63% |
News
Don"t forget to follow the news on ON SEMICONDUCTOR. At the time of publication of this analysis, the latest news was as follows:
- Quantenna Communications, Inc. (QTNA) Alert: Johnson Fistel Investigates Proposed Sale of Quantenna Communications, Inc.; Are Quantenna Shareholders Getting a Fair Deal?
- ON Semiconductor Demonstrates New Cloud-Connected Strata Developer Studio™ at Embedded World 2019
- ON Semiconductor Introduces the RSL10 Sensor Development Kit for Power-Optimized IoT Applications
- Report: Exploring Fundamental Drivers Behind ON Semiconductor, Genesis Energy, NextEra Energy Partners, LP, Microchip Technology, New Senior Investment Group, and GTT Communications — New Horizons, Emerging Trends, and Upcoming Developments
- Consolidated Research: 2018 Summary Expectations for IRHYTHM TECH, ON Semiconductor, CryoPort, Celcuity, InnerWorkings, and AgroFresh Solutions — Fundamental Analysis, Key Performance Indications
About author

Online


Add a comment
Comments
0 comments on the analysis ON SEMICONDUCTOR - Daily