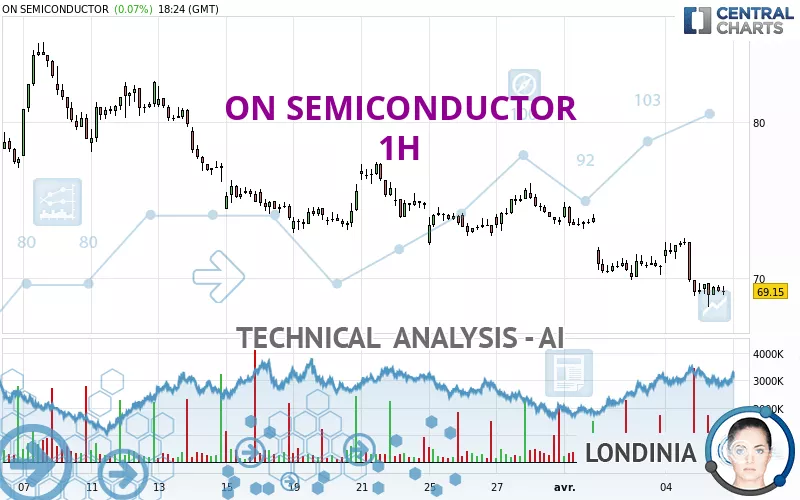
ON SEMICONDUCTOR - 1H - Technical analysis published on 04/05/2024 (GMT)
- 217
- 0
Click here for a new analysis!
- Timeframe : 1H
- - Analysis generated on
- Status : INVALID
Summary of the analysis

Additional analysis
Quotes
The ON SEMICONDUCTOR rating is 69.04 USD. The price registered a decrease of -0.09% on the session with the lowest point at 68.11 USD and the highest point at 69.67 USD. The deviation from the price is +1.37% for the low point and -0.90% for the high point.A study of price movements over other periods shows the following variations:
New LOW record (1st january)
Type : Bearish
Timeframe : Weekly
New LOW record (1 month)
Type : Bearish
Timeframe : Weekly
Technical
A technical analysis in 1H of this ON SEMICONDUCTOR chart shows a sharp bearish trend. 92.86% of the signals given by moving averages are bearish. The overall trend is supported by the strong bearish signals from short-term moving averages. The Central Indicators market scanner currently does not detect any result that concerns moving averages.
The probability of a further decline is low given the direction of the technical indicators.
Caution: the Central Indicators scanner currently detects an excess:
MACD indicator: bullish divergence
Type : Bullish
Timeframe : 1 hour
Pivot points : price is under support 3
Type : Neutral
Timeframe : Weekly
The Central Patterns scanner, which studies chart patterns, resistances and supports, has identified these signals:
Near horizontal resistance
Type : Bearish
Timeframe : 1 hour
Near support of channel
Type : Bullish
Timeframe : 1 hour
The Central Candlesticks scanner which studies Japanese candlesticks did not detect anything.
| S3 | S2 | S1 | Price | R1 | R2 | R3 | |
|---|---|---|---|---|---|---|---|
| ProTrendLines | 35.12 | 46.84 | 62.64 | 69.04 | 70.19 | 76.71 | 79.81 |
| Change (%) | -49.13% | -32.16% | -9.27% | - | +1.67% | +11.11% | +15.60% |
| Change | -33.92 | -22.20 | -6.40 | - | +1.15 | +7.67 | +10.77 |
| Level | Minor | Intermediate | Major | - | Major | Major | Minor |
Pivot points can also be used to set your price objectives. Here is the price situation in relation to pivot points:
| Pivot points | S3 | S2 | S1 | PP | R1 | R2 | R3 |
|---|---|---|---|---|---|---|---|
| Standard | 64.01 | 66.41 | 67.75 | 70.15 | 71.49 | 73.89 | 75.23 |
| Camarilla | 68.07 | 68.41 | 68.76 | 69.10 | 69.44 | 69.79 | 70.13 |
| Woodie | 63.49 | 66.15 | 67.23 | 69.89 | 70.97 | 73.63 | 74.71 |
| Fibonacci | 66.41 | 67.84 | 68.72 | 70.15 | 71.58 | 72.46 | 73.89 |
| Pivot points | S3 | S2 | S1 | PP | R1 | R2 | R3 |
|---|---|---|---|---|---|---|---|
| Standard | 67.79 | 69.96 | 71.75 | 73.92 | 75.71 | 77.88 | 79.67 |
| Camarilla | 72.46 | 72.82 | 73.19 | 73.55 | 73.91 | 74.28 | 74.64 |
| Woodie | 67.61 | 69.87 | 71.57 | 73.83 | 75.53 | 77.79 | 79.49 |
| Fibonacci | 69.96 | 71.47 | 72.40 | 73.92 | 75.43 | 76.36 | 77.88 |
| Pivot points | S3 | S2 | S1 | PP | R1 | R2 | R3 |
|---|---|---|---|---|---|---|---|
| Standard | 55.69 | 63.90 | 68.73 | 76.94 | 81.77 | 89.98 | 94.81 |
| Camarilla | 69.96 | 71.16 | 72.36 | 73.55 | 74.75 | 75.94 | 77.14 |
| Woodie | 53.99 | 63.06 | 67.03 | 76.10 | 80.07 | 89.14 | 93.11 |
| Fibonacci | 63.90 | 68.89 | 71.96 | 76.94 | 81.93 | 85.00 | 89.98 |
Numerical data
The following is the status of technical indicators and moving averages registered at the time this technical analysis was created:
| RSI (14): | 37.96 | |
| MACD (12,26,9): | -0.8100 | |
| Directional Movement: | -22.94 | |
| AROON (14): | -35.71 | |
| DEMA (21): | 69.33 | |
| Parabolic SAR (0,02-0,02-0,2): | 71.43 | |
| Elder Ray (13): | -0.80 | |
| Super Trend (3,10): | 71.66 | |
| Zig ZAG (10): | 69.24 | |
| VORTEX (21): | 0.8800 | |
| Stochastique (14,3,5): | 25.74 | |
| TEMA (21): | 69.13 | |
| Williams %R (14): | -75.20 | |
| Chande Momentum Oscillator (20): | -2.54 | |
| Repulse (5,40,3): | -0.1700 | |
| ROCnROLL: | 2 | |
| TRIX (15,9): | -0.1400 | |
| Courbe Coppock: | 4.26 |
| MA7: | 71.79 | |
| MA20: | 74.90 | |
| MA50: | 76.22 | |
| MA100: | 76.07 | |
| MAexp7: | 69.50 | |
| MAexp20: | 70.39 | |
| MAexp50: | 71.75 | |
| MAexp100: | 73.34 | |
| Price / MA7: | -3.83% | |
| Price / MA20: | -7.82% | |
| Price / MA50: | -9.42% | |
| Price / MA100: | -9.24% | |
| Price / MAexp7: | -0.66% | |
| Price / MAexp20: | -1.92% | |
| Price / MAexp50: | -3.78% | |
| Price / MAexp100: | -5.86% |
News
Don't forget to follow the news on ON SEMICONDUCTOR. At the time of publication of this analysis, the latest news was as follows:
- ON IMPORTANT DEADLINE: ROSEN, RECOGNIZED INVESTOR COUNSEL, Encourages ON Semiconductor Corporation Investors with Losses in Excess of $100K to Secure Counsel Before Important February 12 Deadline in Securities Class Action - ON
- ON SEMICONDUCTOR SHAREHOLDER ACTION REMINDER
- ON Investors Have Opportunity to Lead ON Semiconductor Corporation Securities Fraud Lawsuit
- The Gross Law Firm Notifies ON Semiconductor Corporation Investors of a Class Action Lawsuit and Upcoming Deadline - ON
- SHAREHOLDER ALERT: Pomerantz Law Firm Announces the Filing of a Class Action Against ON Semiconductor Corporation - ON
About author
Online


Add a comment
Comments
0 comments on the analysis ON SEMICONDUCTOR - 1H