| Open: | - |
| Change: | - |
| Volume: | - |
| Low: | - |
| High: | - |
| High / Low range: | - |
| Type: | Stocks |
| Ticker: | HELE |
| ISIN: | BMG4388N1065 |
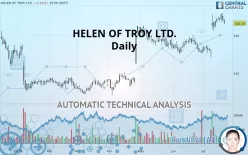
HELEN OF TROY LTD. - Daily - Technical analysis published on 07/23/2019 (GMT)
- 297
- 0
- 07/23/2019 - 08:29
- Who voted?
Click here for a new analysis!
- Timeframe : Daily
- - Analysis generated on 07/23/2019 - 08:29
- Status : TARGET REACHED

Summary of the analysis

Additional analysis
Quotes
HELEN OF TROY LTD. rating 146.28 USD. The price is lower by -1.14% since the last closing and was traded between 145.52 USD and 148.32 USD over the period. The price is currently at +0.52% from its lowest and -1.38% from its highest.A bullish opening was detected by the Central Gaps scanner. Buyers are trying to impose a bullish momentum in the very short term.
Bullish opening
Type : Bullish
Timeframe : Openning
So that you have an overall view of the price change, here is a table showing the variations over several periods:
Near a new HIGH record (5 years)
Type : Bullish
Timeframe : Weekly
Near a new HIGH record (1 year)
Type : Bullish
Timeframe : Weekly
Near a new HIGH record (1st january)
Type : Bullish
Timeframe : Weekly
Near a new HIGH record (1 month)
Type : Bullish
Timeframe : Weekly
Technical
A technical analysis in Daily of this HELEN OF TROY LTD. chart shows a strongly bullish trend. 92.86% of the signals given by moving averages are bullish. The overall trend is supported by the strong bullish signals from short-term moving averages. There is no crossing of moving average by the price or crossing of moving averages between themselves.
The probability of a further increase are moderate given the direction of the technical indicators.
Caution: the Central Indicators scanner currently detects an excess:
Williams %R indicator is overbought : over -20
Type : Neutral
Timeframe : Daily
Pivot points : price is under support 1
Type : Neutral
Timeframe : Daily
Ichimoku - Bullish crossover : Tenkan & Kijun
Type : Bullish
Timeframe : Daily
Central Patterns, the scanner specializing in chart patterns, did not identify any signals.
No result was found by the Central Candlesticks scanner on Japanese candlesticks.
| S3 | S2 | S1 | Price | |
|---|---|---|---|---|
| ProTrendLines | 130.68 | 138.35 | 144.99 | 146.28 |
| Change (%) | -10.66% | -5.42% | -0.88% | - |
| Change | -15.60 | -7.93 | -1.29 | - |
| Level | Major | Intermediate | Major | - |
Attention could also be paid to pivot points to set price objectives:
| Pivot points | S3 | S2 | S1 | PP | R1 | R2 | R3 |
|---|---|---|---|---|---|---|---|
| Standard | 142.46 | 145.06 | 146.52 | 149.12 | 150.58 | 153.18 | 154.64 |
| Camarilla | 146.85 | 147.23 | 147.60 | 147.97 | 148.34 | 148.71 | 149.09 |
| Woodie | 141.88 | 144.78 | 145.94 | 148.84 | 150.00 | 152.90 | 154.06 |
| Fibonacci | 145.06 | 146.61 | 147.57 | 149.12 | 150.67 | 151.63 | 153.18 |
| Pivot points | S3 | S2 | S1 | PP | R1 | R2 | R3 |
|---|---|---|---|---|---|---|---|
| Standard | 140.81 | 143.74 | 145.86 | 148.79 | 150.91 | 153.84 | 155.96 |
| Camarilla | 146.58 | 147.04 | 147.51 | 147.97 | 148.43 | 148.90 | 149.36 |
| Woodie | 140.40 | 143.54 | 145.45 | 148.59 | 150.50 | 153.64 | 155.55 |
| Fibonacci | 143.74 | 145.67 | 146.86 | 148.79 | 150.72 | 151.91 | 153.84 |
| Pivot points | S3 | S2 | S1 | PP | R1 | R2 | R3 |
|---|---|---|---|---|---|---|---|
| Standard | 116.57 | 123.23 | 126.91 | 133.56 | 137.25 | 143.90 | 147.58 |
| Camarilla | 127.75 | 128.70 | 129.64 | 130.59 | 131.54 | 132.49 | 133.43 |
| Woodie | 115.08 | 122.48 | 125.42 | 132.82 | 135.76 | 143.16 | 146.10 |
| Fibonacci | 123.23 | 127.18 | 129.62 | 133.56 | 137.51 | 139.95 | 143.90 |
Numerical data
The following is the status of the technical indicators and moving averages at the time of publication of this technical analysis:
| RSI (14): | 61.05 | |
| MACD (12,26,9): | 3.8500 | |
| Directional Movement: | 17.71 | |
| AROON (14): | 57.15 | |
| DEMA (21): | 146.56 | |
| Parabolic SAR (0,02-0,02-0,2): | 132.78 | |
| Elder Ray (13): | 2.68 | |
| Super Trend (3,10): | 137.83 | |
| Zig ZAG (10): | 146.28 | |
| VORTEX (21): | 0.9600 | |
| Stochastique (14,3,5): | 85.75 | |
| TEMA (21): | 148.95 | |
| Williams %R (14): | -23.53 | |
| Chande Momentum Oscillator (20): | 12.11 | |
| Repulse (5,40,3): | -1.8300 | |
| ROCnROLL: | 1 | |
| TRIX (15,9): | 0.2800 | |
| Courbe Coppock: | 22.13 |
| MA7: | 148.35 | |
| MA20: | 139.43 | |
| MA50: | 137.33 | |
| MA100: | 128.60 | |
| MAexp7: | 146.79 | |
| MAexp20: | 142.08 | |
| MAexp50: | 137.11 | |
| MAexp100: | 132.31 | |
| Price / MA7: | -1.40% | |
| Price / MA20: | +4.91% | |
| Price / MA50: | +6.52% | |
| Price / MA100: | +13.75% | |
| Price / MAexp7: | -0.35% | |
| Price / MAexp20: | +2.96% | |
| Price / MAexp50: | +6.69% | |
| Price / MAexp100: | +10.56% |
News
The latest news and videos published on HELEN OF TROY LTD. at the time of the analysis were as follows:
- 01/23/2019 - 14:00 Grab Stinky Bathroom Smells and Cigarette Smoke with the New Febreze® OdorGrab™ Air Cleaner
- 10/23/2018 - 11:55 Report: Exploring Fundamental Drivers Behind Helen of Troy, BioPharmX, Fair Isaac, Frontier Communications, ICU Medical, and Darling Ingredients — New Horizons, Emerging Trends, and Upcoming Developments
- 05/21/2018 - 13:00 Trista Sutter Opens Up About Her Family's Allergies And Solutions
- 10/05/2017 - 12:00 Investor Network: Helen of Troy Limited to Host Earnings Call
- 07/11/2017 - 19:45 Don't Sweat It! Marketers of Honeywell Fans Partner with Environmental Scientists to Announce the 3rd Annual Ranking of America's Sweatiest Cities
About author

Online


Add a comment
Comments
0 comments on the analysis HELEN OF TROY LTD. - Daily