THE CIGNA GROUP - 1H - Technical analysis published on 10/31/2024 (GMT)
- 126
- 0
Click here for a new analysis!
- Timeframe : 1H
- - Analysis generated on
- Status : INVALID

Summary of the analysis

Additional analysis
Quotes
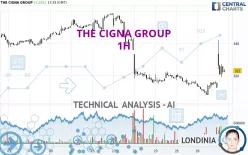
The THE CIGNA GROUP rating is 323.00 USD. The price registered an increase of +3.23% on the session and was traded between 319.11 USD and 342.39 USD over the period. The price is currently at +1.22% from its lowest and -5.66% from its highest.A bullish gap was detected at the opening by the Central Gaps scanner. There are a lot of buyers and they have the upper hand in the very short term.
Opening Gap UP
Type : Bullish
Timeframe : Openning
A study of price movements over other periods shows the following variations:
Near a new HIGH record (1 month)
Type : Bullish
Timeframe : Weekly
Technical
Technical analysis of this 1H chart of THE CIGNA GROUP indicates that the overall trend is not clearly defined. The strong bullish signals currently being given by short-term moving averages could allow the overall trend to return to bullish. There is no crossing of moving average by the price or crossing of moving averages between themselves.
In fact, according to the parameters integrated into the Central Analyzer system, 14 technical indicators out of 18 analysed are currently bullish. But beware of excesses. The Central Indicators scanner currently detects this:
CCI indicator is overbought : over 100
Type : Neutral
Timeframe : 1 hour
Previous candle closed over Bollinger bands
Type : Neutral
Timeframe : 1 hour
Price is back over the pivot point
Type : Bullish
Timeframe : Weekly
Williams %R indicator is back under -50
Type : Bearish
Timeframe : 1 hour
An analysis of the price chart with the Central Patterns scanner (detector of chart patterns and resistances and supports) shows a result that can have an impact on the price change:
Resistance of channel is broken
Type : Bullish
Timeframe : 1 hour
Central Candlesticks, the scanner specialised in Japanese candlesticks, detects a bullish signal that could support the hypothesis of a small rebound in the very short term:
Bullish harami
Type : Bullish
Timeframe : 1 hour
| S3 | S2 | S1 | Price | R1 | R2 | R3 | |
|---|---|---|---|---|---|---|---|
| ProTrendLines | 293.37 | 305.36 | 317.01 | 323.00 | 329.18 | 340.21 | 344.07 |
| Change (%) | -9.17% | -5.46% | -1.85% | - | +1.91% | +5.33% | +6.52% |
| Change | -29.63 | -17.64 | -5.99 | - | +6.18 | +17.21 | +21.07 |
| Level | Major | Intermediate | Minor | - | Major | Intermediate | Minor |
To determine price objectives, it is also possible to use the pivot points. Here is the price position in relation to pivot points:
| Pivot points | S3 | S2 | S1 | PP | R1 | R2 | R3 |
|---|---|---|---|---|---|---|---|
| Standard | 299.89 | 303.94 | 308.42 | 312.47 | 316.95 | 321.00 | 325.48 |
| Camarilla | 310.54 | 311.33 | 312.11 | 312.89 | 313.67 | 314.45 | 315.24 |
| Woodie | 300.10 | 304.05 | 308.63 | 312.58 | 317.16 | 321.11 | 325.69 |
| Fibonacci | 303.94 | 307.20 | 309.22 | 312.47 | 315.73 | 317.75 | 321.00 |
| Pivot points | S3 | S2 | S1 | PP | R1 | R2 | R3 |
|---|---|---|---|---|---|---|---|
| Standard | 291.81 | 303.40 | 310.13 | 321.72 | 328.45 | 340.04 | 346.77 |
| Camarilla | 311.81 | 313.49 | 315.17 | 316.85 | 318.53 | 320.21 | 321.89 |
| Woodie | 289.37 | 302.19 | 307.69 | 320.51 | 326.01 | 338.83 | 344.33 |
| Fibonacci | 303.40 | 310.40 | 314.73 | 321.72 | 328.72 | 333.05 | 340.04 |
| Pivot points | S3 | S2 | S1 | PP | R1 | R2 | R3 |
|---|---|---|---|---|---|---|---|
| Standard | 306.54 | 324.27 | 335.36 | 353.09 | 364.18 | 381.91 | 393.00 |
| Camarilla | 338.52 | 341.16 | 343.80 | 346.44 | 349.08 | 351.72 | 354.37 |
| Woodie | 303.21 | 322.61 | 332.03 | 351.43 | 360.85 | 380.25 | 389.67 |
| Fibonacci | 324.27 | 335.28 | 342.08 | 353.09 | 364.10 | 370.90 | 381.91 |
Numerical data
The following is the status of technical indicators and moving averages registered at the time this technical analysis was created:
| RSI (14): | 57.92 | |
| MACD (12,26,9): | 1.5800 | |
| Directional Movement: | 23.45 | |
| AROON (14): | 57.14 | |
| DEMA (21): | 319.08 | |
| Parabolic SAR (0,02-0,02-0,2): | 319.01 | |
| Elder Ray (13): | 4.18 | |
| Super Trend (3,10): | 318.02 | |
| Zig ZAG (10): | 322.72 | |
| VORTEX (21): | 0.9500 | |
| Stochastique (14,3,5): | 45.22 | |
| TEMA (21): | 322.32 | |
| Williams %R (14): | -57.43 | |
| Chande Momentum Oscillator (20): | 14.29 | |
| Repulse (5,40,3): | -1.7500 | |
| ROCnROLL: | 1 | |
| TRIX (15,9): | 0.0000 | |
| Courbe Coppock: | 5.71 |
| MA7: | 315.94 | |
| MA20: | 333.56 | |
| MA50: | 346.15 | |
| MA100: | 340.29 | |
| MAexp7: | 321.08 | |
| MAexp20: | 317.89 | |
| MAexp50: | 319.81 | |
| MAexp100: | 326.67 | |
| Price / MA7: | +2.23% | |
| Price / MA20: | -3.17% | |
| Price / MA50: | -6.69% | |
| Price / MA100: | -5.08% | |
| Price / MAexp7: | +0.60% | |
| Price / MAexp20: | +1.61% | |
| Price / MAexp50: | +1.00% | |
| Price / MAexp100: | -1.12% |
News
The latest news and videos published on THE CIGNA GROUP at the time of the analysis were as follows:
- The Cigna Group Reports Strong Third Quarter 2024 Results, Reaffirms 2024 Adjusted EPS Outlook
- The Cigna Group Declares Quarterly Dividend
- The Cigna Group's Third Quarter 2024 Earnings Release Details
- The Cigna Group Issues 2024 Vitality In America Report, Revealing Increased Optimism Among Young Americans and Offering Insights on Workforce Health and Engagement
- The Cigna Group and Business Roundtable Host Workforce Mental Health Summit
About author
Online


Add a comment
Comments
0 comments on the analysis THE CIGNA GROUP - 1H