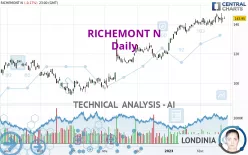
RICHEMONT N - Daily - Technical analysis published on 02/23/2023 (GMT)
- 180
- 0
Click here for a new analysis!
- Timeframe : Daily
- - Analysis generated on
- Status : INVALID

Summary of the analysis

Additional analysis
Quotes
The RICHEMONT N price is 143.9500 CHF. On the day, this instrument lost -0.17% and was between 143.7000 CHF and 145.3500 CHF. This implies that the price is at +0.17% from its lowest and at -0.96% from its highest.A bearish opening was detected by the Central Gaps scanner. Sellers are trying to impose a bearish trend in the very short term.
Bearish opening
Type : Bearish
Timeframe : Openning
So that you have an overall view of the price change, here is a table showing the variations over several periods:
New HIGH record (5 years)
Type : Bullish
Timeframe : Weekly
Near a new HIGH record (1 year)
Type : Bullish
Timeframe : Weekly
Near a new HIGH record (1st january)
Type : Bullish
Timeframe : Weekly
Near a new LOW record (1 month)
Type : Bearish
Timeframe : Weekly
Technical
Technical analysis of this Daily chart of RICHEMONT N indicates that the overall trend is strongly bullish. 92.86% of the signals given by moving averages are bullish. This strongly bullish trend is supported by the strong bullish signals given by short-term moving averages. There is no crossing of moving average by the price or crossing of moving averages between themselves.
Technical indicators are slightly bullish. There is therefore considerable uncertainty about the continuation of the increase.
Caution: the Central Indicators scanner currently detects an excess:
CCI indicator is overbought : over 100
Type : Neutral
Timeframe : Daily
Central Patterns, the scanner specializing in chart patterns, did not identify any signals.
Central Candlesticks, the scanner specialised in Japanese candlesticks, detects this inversion signal that could impact the current short-term trend:
Doji
Type : Neutral
Timeframe : Daily
| S3 | S2 | S1 | Price | R1 | |
|---|---|---|---|---|---|
| ProTrendLines | 116.0500 | 125.3500 | 139.8670 | 143.9500 | 144.7500 |
| Change (%) | -19.38% | -12.92% | -2.84% | - | +0.56% |
| Change | -27.9000 | -18.6000 | -4.0830 | - | +0.8000 |
| Level | Major | Minor | Major | - | Major |
Pivot points can also be used to set your price objectives. Here is the price situation in relation to pivot points:
| Pivot points | S3 | S2 | S1 | PP | R1 | R2 | R3 |
|---|---|---|---|---|---|---|---|
| Standard | 138.9333 | 140.0667 | 142.1333 | 143.2667 | 145.3333 | 146.4667 | 148.5333 |
| Camarilla | 143.3200 | 143.6133 | 143.9067 | 144.2000 | 144.4933 | 144.7867 | 145.0800 |
| Woodie | 139.4000 | 140.3000 | 142.6000 | 143.5000 | 145.8000 | 146.7000 | 149.0000 |
| Fibonacci | 140.0667 | 141.2891 | 142.0443 | 143.2667 | 144.4891 | 145.2443 | 146.4667 |
| Pivot points | S3 | S2 | S1 | PP | R1 | R2 | R3 |
|---|---|---|---|---|---|---|---|
| Standard | 131.9333 | 135.6667 | 139.8333 | 143.5667 | 147.7333 | 151.4667 | 155.6333 |
| Camarilla | 141.8275 | 142.5517 | 143.2758 | 144.0000 | 144.7242 | 145.4483 | 146.1725 |
| Woodie | 132.1500 | 135.7750 | 140.0500 | 143.6750 | 147.9500 | 151.5750 | 155.8500 |
| Fibonacci | 135.6667 | 138.6845 | 140.5489 | 143.5667 | 146.5845 | 148.4489 | 151.4667 |
| Pivot points | S3 | S2 | S1 | PP | R1 | R2 | R3 |
|---|---|---|---|---|---|---|---|
| Standard | 105.4500 | 113.7000 | 127.0500 | 135.3000 | 148.6500 | 156.9000 | 170.2500 |
| Camarilla | 134.4600 | 136.4400 | 138.4200 | 140.4000 | 142.3800 | 144.3600 | 146.3400 |
| Woodie | 108.0000 | 114.9750 | 129.6000 | 136.5750 | 151.2000 | 158.1750 | 172.8000 |
| Fibonacci | 113.7000 | 121.9512 | 127.0488 | 135.3000 | 143.5512 | 148.6488 | 156.9000 |
Numerical data
The following are the details of the technical indicators and moving averages that were collected to generate this technical analysis:
| RSI (14): | 60.71 | |
| MACD (12,26,9): | 2.5709 | |
| Directional Movement: | 16.1677 | |
| AROON (14): | 50.0000 | |
| DEMA (21): | 145.8049 | |
| Parabolic SAR (0,02-0,02-0,2): | 140.6000 | |
| Elder Ray (13): | 1.2669 | |
| Super Trend (3,10): | 136.3364 | |
| Zig ZAG (10): | 144.4500 | |
| VORTEX (21): | 1.0108 | |
| Stochastique (14,3,5): | 63.47 | |
| TEMA (21): | 144.8311 | |
| Williams %R (14): | -35.59 | |
| Chande Momentum Oscillator (20): | 4.6500 | |
| Repulse (5,40,3): | 1.9720 | |
| ROCnROLL: | 1 | |
| TRIX (15,9): | 0.3026 | |
| Courbe Coppock: | 3.92 |
| MA7: | 144.5571 | |
| MA20: | 142.5975 | |
| MA50: | 134.7000 | |
| MA100: | 121.8735 | |
| MAexp7: | 144.0088 | |
| MAexp20: | 142.0630 | |
| MAexp50: | 135.4082 | |
| MAexp100: | 127.0180 | |
| Price / MA7: | -0.42% | |
| Price / MA20: | +0.95% | |
| Price / MA50: | +6.87% | |
| Price / MA100: | +18.11% | |
| Price / MAexp7: | -0.04% | |
| Price / MAexp20: | +1.33% | |
| Price / MAexp50: | +6.31% | |
| Price / MAexp100: | +13.33% |
News
Don't forget to follow the news on RICHEMONT N. At the time of publication of this analysis, the latest news was as follows:
- RICHEMONT APPOINTS DR BERANGERE RUCHAT TO SENIOR EXECUTIVE COMMITTEE
- NOMINATION OF BRAM SCHOT TO THE BOARD OF DIRECTORS
- richemont REPORTS SALES INCREASE of 8% FOR THE THIRD QUARTER AND 18% for THE NINE MONTHS ENDED 31 DECEMBER 2022
- RICHEMONT’S 2022 INTERIM REPORT NOW AVAILABLE ONLINE
- RICHEMONT ANNOUNCES STRONG PERFORMANCE FOR THE SIX-MONTH PERIOD ENDED 30 SEPTEMBER 2022
About author
Online


Add a comment
Comments
0 comments on the analysis RICHEMONT N - Daily