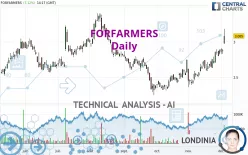
FORFARMERS - Daily - Technical analysis published on 12/05/2022 (GMT)
- 229
- 0
Click here for a new analysis!
- Timeframe : Daily
- - Analysis generated on
- Status : INVALID

Summary of the analysis

Additional analysis
Quotes
FORFARMERS rating 3.085 EUR. The price registered an increase of +7.12% on the session and was traded between 2.975 EUR and 3.185 EUR over the period. The price is currently at +3.70% from its lowest and -3.14% from its highest.A bullish gap was detected at the opening by the Central Gaps scanner. There are a lot of buyers and they have the upper hand in the very short term.
Opening Gap UP
Type : Bullish
Timeframe : Openning
So that you have an overall view of the price change, here is a table showing the variations over several periods:
New HIGH record (1 month)
Type : Bullish
Timeframe : Weekly
Technical
Technical analysis of FORFARMERS in Daily shows a strongly overall bullish trend. The signals given by the moving averages are 82.14% bullish. This strong bullish trend is confirmed by the strong signals currently being given by short-term moving averages. There is no crossing of moving average by the price or crossing of moving averages between themselves.
Technical indicators are strongly bullish, suggesting that the price increase should continue.
Caution: the Central Indicators scanner currently detects an excess:
RSI indicator is overbought : over 70
Type : Neutral
Timeframe : Daily
CCI indicator is overbought : over 100
Type : Neutral
Timeframe : Daily
Williams %R indicator is overbought : over -20
Type : Neutral
Timeframe : Daily
Pivot points : price is over resistance 3
Type : Neutral
Timeframe : Daily
Pivot points : price is over resistance 3
Type : Neutral
Timeframe : Weekly
An analysis of the price chart with the Central Patterns scanner (detector of chart patterns and resistances and supports) shows several results that can have an impact on the price change:
Horizontal resistance is broken
Type : Bullish
Timeframe : Daily
Resistance of channel is broken
Type : Bullish
Timeframe : Daily
Central Candlesticks, the scanner specialised in Japanese candlesticks, detects a bullish signal that could support the hypothesis of a small rebound in the very short term:
Upside gap
Type : Bullish
Timeframe : Daily
| S3 | S2 | S1 | Price | R1 | R2 | R3 | |
|---|---|---|---|---|---|---|---|
| ProTrendLines | 2.572 | 2.746 | 3.000 | 3.085 | 3.279 | 3.390 | 4.011 |
| Change (%) | -16.63% | -10.99% | -2.76% | - | +6.29% | +9.89% | +30.02% |
| Change | -0.513 | -0.339 | -0.085 | - | +0.194 | +0.305 | +0.926 |
| Level | Major | Major | Minor | - | Intermediate | Intermediate | Minor |
To determine price objectives, it is also possible to use the pivot points. Here is the price position in relation to pivot points:
| Pivot points | S3 | S2 | S1 | PP | R1 | R2 | R3 |
|---|---|---|---|---|---|---|---|
| Standard | 2.770 | 2.800 | 2.840 | 2.870 | 2.910 | 2.940 | 2.980 |
| Camarilla | 2.861 | 2.867 | 2.874 | 2.880 | 2.886 | 2.893 | 2.899 |
| Woodie | 2.775 | 2.803 | 2.845 | 2.873 | 2.915 | 2.943 | 2.985 |
| Fibonacci | 2.800 | 2.827 | 2.843 | 2.870 | 2.897 | 2.913 | 2.940 |
| Pivot points | S3 | S2 | S1 | PP | R1 | R2 | R3 |
|---|---|---|---|---|---|---|---|
| Standard | 2.700 | 2.750 | 2.815 | 2.865 | 2.930 | 2.980 | 3.045 |
| Camarilla | 2.848 | 2.859 | 2.870 | 2.880 | 2.891 | 2.901 | 2.912 |
| Woodie | 2.708 | 2.754 | 2.823 | 2.869 | 2.938 | 2.984 | 3.053 |
| Fibonacci | 2.750 | 2.794 | 2.821 | 2.865 | 2.909 | 2.936 | 2.980 |
| Pivot points | S3 | S2 | S1 | PP | R1 | R2 | R3 |
|---|---|---|---|---|---|---|---|
| Standard | 1.993 | 2.177 | 2.528 | 2.712 | 3.063 | 3.247 | 3.598 |
| Camarilla | 2.733 | 2.782 | 2.831 | 2.880 | 2.929 | 2.978 | 3.027 |
| Woodie | 2.078 | 2.219 | 2.613 | 2.754 | 3.148 | 3.289 | 3.683 |
| Fibonacci | 2.177 | 2.381 | 2.507 | 2.712 | 2.916 | 3.042 | 3.247 |
Numerical data
The following are the details of the technical indicators and moving averages that were collected to generate this technical analysis:
| RSI (14): | 72.53 | |
| MACD (12,26,9): | 0.1040 | |
| Directional Movement: | 32.979 | |
| AROON (14): | 85.714 | |
| DEMA (21): | 2.881 | |
| Parabolic SAR (0,02-0,02-0,2): | 2.711 | |
| Elder Ray (13): | 0.262 | |
| Super Trend (3,10): | 2.735 | |
| Zig ZAG (10): | 3.090 | |
| VORTEX (21): | 1.1850 | |
| Stochastique (14,3,5): | 85.96 | |
| TEMA (21): | 2.959 | |
| Williams %R (14): | -15.97 | |
| Chande Momentum Oscillator (20): | 0.480 | |
| Repulse (5,40,3): | 3.2880 | |
| ROCnROLL: | 1 | |
| TRIX (15,9): | 0.4220 | |
| Courbe Coppock: | 20.77 |
| MA7: | 2.887 | |
| MA20: | 2.725 | |
| MA50: | 2.562 | |
| MA100: | 2.730 | |
| MAexp7: | 2.892 | |
| MAexp20: | 2.759 | |
| MAexp50: | 2.674 | |
| MAexp100: | 2.719 | |
| Price / MA7: | +6.86% | |
| Price / MA20: | +13.21% | |
| Price / MA50: | +20.41% | |
| Price / MA100: | +13.00% | |
| Price / MAexp7: | +6.67% | |
| Price / MAexp20: | +11.82% | |
| Price / MAexp50: | +15.37% | |
| Price / MAexp100: | +13.46% |
News
The last news published on FORFARMERS at the time of the generation of this analysis was as follows:
- ForFarmers N.V.: ForFarmers announces revised Strategy 2025
- ForFarmers N.V.: ForFarmers announces departure CEO Chris Deen
- ForFarmers N.V.: ForFarmers 2022 first-half results
- ForFarmers N.V.: ForFarmers: Extra update results due to positive developments abroad
- ForFarmers N.V.: ForFarmers first quarter 2022 Trading Update
About author
Online


Add a comment
Comments
0 comments on the analysis FORFARMERS - Daily