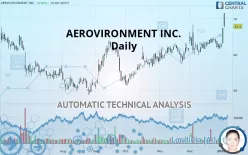
AEROVIRONMENT INC. - Daily - Technical analysis published on 01/06/2020 (GMT)
- 405
- 0
Click here for a new analysis!
- Timeframe : Daily
- - Analysis generated on
- Status : TARGET REACHED

Summary of the analysis

Additional analysis
Quotes
The AEROVIRONMENT INC. rating is 67.90 USD. The price has increased by +0.88% since the last closing with the lowest point at 67.60 USD and the highest point at 71.60 USD. The deviation from the price is +0.44% for the low point and -5.17% for the high point.A bullish gap was detected at the opening by the Central Gaps scanner. There are a lot of buyers and they have the upper hand in the very short term.
Opening Gap UP
Type : Bullish
Timeframe : Openning
So that you have an overall view of the price change, here is a table showing the variations over several periods:
Technical
Technical analysis of this Daily chart of AEROVIRONMENT INC. indicates that the overall trend is strongly bullish. 92.86% of the signals given by moving averages are bullish. The overall trend is supported by the strong bullish signals from short-term moving averages. An assessment of moving averages reveals a bullish signal that could impact this trend:
Bullish trend reversal : Moving Average 20
Type : Bullish
Timeframe : Daily
In fact, 15 technical indicators on 18 studied are currently bullish. But beware of excesses. The Central Indicators scanner currently detects this:
CCI indicator is overbought : over 100
Type : Neutral
Timeframe : Daily
Williams %R indicator is overbought : over -20
Type : Neutral
Timeframe : Daily
MACD crosses UP its Moving Average
Type : Bullish
Timeframe : Daily
Parabolic SAR indicator bullish reversal
Type : Bullish
Timeframe : Daily
Ichimoku - Bullish crossover : Tenkan & Kijun
Type : Bullish
Timeframe : Daily
Price is back over the pivot point
Type : Bullish
Timeframe : Daily
Price is back over the pivot point
Type : Bullish
Timeframe : Weekly
Williams %R indicator is back over -50
Type : Bullish
Timeframe : Daily
Central Patterns, the market scanner focusing on chart patterns, resistances and supports found these results:
Horizontal resistance is broken
Type : Bullish
Timeframe : Daily
Resistance of channel is broken
Type : Bullish
Timeframe : Daily
Resistance of triangle is broken
Type : Bullish
Timeframe : Daily
The presence of a bullish Japanese candlestick pattern detected by Central Candlesticks that could cause a very short term rebound was also detected:
Upside gap
Type : Bullish
Timeframe : Daily
| S3 | S2 | S1 | Price | R1 | R2 | R3 | |
|---|---|---|---|---|---|---|---|
| ProTrendLines | 55.07 | 64.82 | 66.83 | 67.90 | 68.96 | 70.85 | 83.95 |
| Change (%) | -18.90% | -4.54% | -1.58% | - | +1.56% | +4.34% | +23.64% |
| Change | -12.83 | -3.08 | -1.07 | - | +1.06 | +2.95 | +16.05 |
| Level | Minor | Major | Intermediate | - | Intermediate | Major | Intermediate |
Attention could also be paid to pivot points to set price objectives:
| Pivot points | S3 | S2 | S1 | PP | R1 | R2 | R3 |
|---|---|---|---|---|---|---|---|
| Standard | 60.02 | 61.54 | 64.43 | 65.95 | 68.84 | 70.36 | 73.25 |
| Camarilla | 66.10 | 66.50 | 66.91 | 67.31 | 67.71 | 68.12 | 68.52 |
| Woodie | 60.70 | 61.88 | 65.11 | 66.29 | 69.52 | 70.70 | 73.93 |
| Fibonacci | 61.54 | 63.23 | 64.27 | 65.95 | 67.64 | 68.68 | 70.36 |
| Pivot points | S3 | S2 | S1 | PP | R1 | R2 | R3 |
|---|---|---|---|---|---|---|---|
| Standard | 57.43 | 59.48 | 63.39 | 65.44 | 69.35 | 71.40 | 75.31 |
| Camarilla | 65.67 | 66.22 | 66.76 | 67.31 | 67.86 | 68.40 | 68.95 |
| Woodie | 58.37 | 59.95 | 64.33 | 65.91 | 70.29 | 71.87 | 76.25 |
| Fibonacci | 59.48 | 61.75 | 63.16 | 65.44 | 67.71 | 69.12 | 71.40 |
| Pivot points | S3 | S2 | S1 | PP | R1 | R2 | R3 |
|---|---|---|---|---|---|---|---|
| Standard | 49.94 | 54.94 | 58.34 | 63.35 | 66.74 | 71.75 | 75.15 |
| Camarilla | 59.43 | 60.20 | 60.97 | 61.74 | 62.51 | 63.28 | 64.05 |
| Woodie | 49.14 | 54.54 | 57.54 | 62.94 | 65.94 | 71.35 | 74.35 |
| Fibonacci | 54.94 | 58.15 | 60.14 | 63.35 | 66.56 | 68.54 | 71.75 |
Numerical data
The following is the status of the technical indicators and moving averages at the time of publication of this technical analysis:
| RSI (14): | 70.09 | |
| MACD (12,26,9): | 1.2500 | |
| Directional Movement: | 33.59 | |
| AROON (14): | 92.86 | |
| DEMA (21): | 65.10 | |
| Parabolic SAR (0,02-0,02-0,2): | 60.10 | |
| Elder Ray (13): | 5.93 | |
| Super Trend (3,10): | 63.72 | |
| Zig ZAG (10): | 68.37 | |
| VORTEX (21): | 1.1700 | |
| Stochastique (14,3,5): | 70.63 | |
| TEMA (21): | 65.31 | |
| Williams %R (14): | -32.71 | |
| Chande Momentum Oscillator (20): | 5.13 | |
| Repulse (5,40,3): | -0.3700 | |
| ROCnROLL: | 1 | |
| TRIX (15,9): | 0.1800 | |
| Courbe Coppock: | 7.65 |
| MA7: | 64.13 | |
| MA20: | 63.40 | |
| MA50: | 61.72 | |
| MA100: | 58.67 | |
| MAexp7: | 65.10 | |
| MAexp20: | 63.73 | |
| MAexp50: | 61.83 | |
| MAexp100: | 60.62 | |
| Price / MA7: | +5.88% | |
| Price / MA20: | +7.10% | |
| Price / MA50: | +10.01% | |
| Price / MA100: | +15.73% | |
| Price / MAexp7: | +4.30% | |
| Price / MAexp20: | +6.54% | |
| Price / MAexp50: | +9.82% | |
| Price / MAexp100: | +12.01% |
News
The last news published on AEROVIRONMENT INC. at the time of the generation of this analysis was as follows:
- AeroVironment, Inc. to Present at the Raymond James 2019 Technology Investors Conference
- AeroVironment, Inc. Announces Fiscal 2020 Second Quarter Results
- AeroVironment Receives $5.25 Million Puma 3 AE Contract for U.S. Border Patrol
- AeroVironment Recognized as a Great Place to Work-Certified Company
- AeroVironment Launches New Puma™ LE, Delivering Group 2 Capabilities in a Group 1 Footprint with Increased Range, Endurance and Payload Capacity
About author

Online


Add a comment
Comments
0 comments on the analysis AEROVIRONMENT INC. - Daily