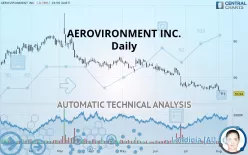
AEROVIRONMENT INC. - Daily - Technical analysis published on 08/08/2019 (GMT)
- 390
- 0
- Who voted?
Click here for a new analysis!
- Timeframe : Daily
- - Analysis generated on
- Status : LEVEL MAINTAINED

Summary of the analysis

Additional analysis
Quotes
AEROVIRONMENT INC. rating 50.94 USD. The price is lower by -0.78% since the last closing and was between 50.18 USD and 51.65 USD. This implies that the price is at +1.51% from its lowest and at -1.37% from its highest.The Central Gaps scanner detects a bullish opening marking the presence of sellers ahead of buyers at the opening but not sufficiently marked to allow the price to register a quotation gap.
Bearish opening
Type : Bearish
Timeframe : Openning
So that you have an overall view of the price change, here is a table showing the variations over several periods:
Near a new LOW record (1 year)
Type : Bearish
Timeframe : Weekly
Near a new LOW record (1st january)
Type : Bearish
Timeframe : Weekly
Near a new LOW record (1 month)
Type : Bearish
Timeframe : Weekly
Technical
A technical analysis in Daily of this AEROVIRONMENT INC. chart shows a sharp bearish trend. 92.86% of the signals given by moving averages are bearish. The overall trend is supported by the strong bearish signals from short-term moving averages. The Central Indicators scanner does not detect any result on moving averages that would impact this trend.
In fact, according to the parameters integrated into the Central Analyzer system, 13 technical indicators out of 18 analysed are currently bearish. Caution: the Central Indicators scanner currently detects an excess:
CCI indicator is oversold : under -100
Type : Neutral
Timeframe : Daily
Previous candle closed under Bollinger bands
Type : Neutral
Timeframe : Daily
Williams %R indicator is oversold : under -80
Type : Neutral
Timeframe : Daily
MACD crosses DOWN its Moving Average
Type : Bearish
Timeframe : Daily
Price is back under the pivot point
Type : Bearish
Timeframe : Weekly
No signals are given by Central Patterns, a market scanner specialised in chart patterns, resistances and supports.
The Central Candlesticks scanner currently notes the presence of this pattern in Japanese candlesticks that could mark the end of the short-term trend currently underway:
Doji
Type : Neutral
Timeframe : Daily
| S3 | S2 | S1 | Price | R1 | R2 | R3 | |
|---|---|---|---|---|---|---|---|
| ProTrendLines | 18.72 | 29.69 | 41.39 | 50.94 | 56.01 | 64.82 | 83.95 |
| Change (%) | -63.25% | -41.72% | -18.75% | - | +9.95% | +27.25% | +64.80% |
| Change | -32.22 | -21.25 | -9.55 | - | +5.07 | +13.88 | +33.01 |
| Level | Intermediate | Intermediate | Intermediate | - | Intermediate | Major | Major |
Pivot points can also be used to set your price objectives. Here is the price situation in relation to pivot points:
| Pivot points | S3 | S2 | S1 | PP | R1 | R2 | R3 |
|---|---|---|---|---|---|---|---|
| Standard | 48.85 | 49.58 | 50.46 | 51.19 | 52.07 | 52.80 | 53.68 |
| Camarilla | 50.90 | 51.05 | 51.19 | 51.34 | 51.49 | 51.64 | 51.78 |
| Woodie | 48.93 | 49.62 | 50.54 | 51.23 | 52.15 | 52.84 | 53.76 |
| Fibonacci | 49.58 | 50.20 | 50.58 | 51.19 | 51.81 | 52.19 | 52.80 |
| Pivot points | S3 | S2 | S1 | PP | R1 | R2 | R3 |
|---|---|---|---|---|---|---|---|
| Standard | 45.02 | 48.31 | 50.42 | 53.71 | 55.82 | 59.11 | 61.22 |
| Camarilla | 51.06 | 51.55 | 52.05 | 52.54 | 53.04 | 53.53 | 54.03 |
| Woodie | 44.44 | 48.02 | 49.84 | 53.42 | 55.24 | 58.82 | 60.64 |
| Fibonacci | 48.31 | 50.37 | 51.64 | 53.71 | 55.77 | 57.04 | 59.11 |
| Pivot points | S3 | S2 | S1 | PP | R1 | R2 | R3 |
|---|---|---|---|---|---|---|---|
| Standard | 47.25 | 50.12 | 52.49 | 55.36 | 57.73 | 60.60 | 62.97 |
| Camarilla | 53.41 | 53.89 | 54.37 | 54.85 | 55.33 | 55.81 | 56.29 |
| Woodie | 46.99 | 50.00 | 52.23 | 55.24 | 57.47 | 60.48 | 62.71 |
| Fibonacci | 50.12 | 52.13 | 53.36 | 55.36 | 57.37 | 58.60 | 60.60 |
Numerical data
The following is the status of technical indicators and moving averages registered at the time this technical analysis was created:
| RSI (14): | 31.78 | |
| MACD (12,26,9): | -1.7900 | |
| Directional Movement: | -14.25 | |
| AROON (14): | -21.42 | |
| DEMA (21): | 51.65 | |
| Parabolic SAR (0,02-0,02-0,2): | 56.00 | |
| Elder Ray (13): | -2.27 | |
| Super Trend (3,10): | 56.22 | |
| Zig ZAG (10): | 50.94 | |
| VORTEX (21): | 0.7800 | |
| Stochastique (14,3,5): | 13.65 | |
| TEMA (21): | 51.70 | |
| Williams %R (14): | -88.45 | |
| Chande Momentum Oscillator (20): | -3.02 | |
| Repulse (5,40,3): | -0.3800 | |
| ROCnROLL: | 2 | |
| TRIX (15,9): | -0.4300 | |
| Courbe Coppock: | 8.30 |
| MA7: | 52.79 | |
| MA20: | 54.01 | |
| MA50: | 58.29 | |
| MA100: | 63.11 | |
| MAexp7: | 52.28 | |
| MAexp20: | 54.08 | |
| MAexp50: | 57.76 | |
| MAexp100: | 62.66 | |
| Price / MA7: | -3.50% | |
| Price / MA20: | -5.68% | |
| Price / MA50: | -12.61% | |
| Price / MA100: | -19.28% | |
| Price / MAexp7: | -2.56% | |
| Price / MAexp20: | -5.81% | |
| Price / MAexp50: | -11.81% | |
| Price / MAexp100: | -18.70% |
News
Don"t forget to follow the news on AEROVIRONMENT INC.. At the time of publication of this analysis, the latest news was as follows:
- AeroVironment, Inc. Schedules Third Quarter Fiscal Year 2019 Earnings Release and Conference Call
- AeroVironment Introduces Next Generation of Quantix Drone and AV DSS with New Product Updates, FMS Integration, Plant Count Beta Trial and Custom-tailored Pricing Packages for Growers to Ag Service Providers
- AeroVironment Collaborates with REIN's DroneInsurance.com to Offer Commercial Drone Insurance Solutions for Quantix™ Hybrid Drone
- AeroVironment Investigated for Securities Fraud by Block & Leviton LLP
- Report: Developing Opportunities within AeroVironment, Seres Therapeutics, HFF, Fluor, KB Home, and H. B. Fuller — Future Expectations, Projections Moving into 2018
About author

Online


Add a comment
Comments
0 comments on the analysis AEROVIRONMENT INC. - Daily