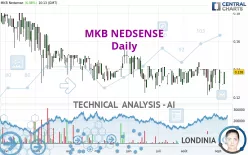
MKB NEDSENSE - Daily - Technical analysis published on 09/07/2022 (GMT)
- 182
- 0
- Timeframe : Daily
- - Analysis generated on
- Status : NEUTRAL

Summary of the analysis

Additional analysis
Quotes
The MKB NEDSENSE rating is 0.1380 EUR. On the day, this instrument gained +6.98% with the lowest point at 0.1295 EUR and the highest point at 0.1380 EUR. The deviation from the price is +6.56% for the low point and 0% for the high point.The Central Gaps scanner detects the formation of a bullish gap marking the strong presence of buyers against sellers at the opening. This formed a quotation gap.
Opening Gap UP
Type : Bullish
Timeframe : Openning
So that you have an overall view of the price change, here is a table showing the variations over several periods:
Technical
A technical analysis in Daily of this MKB NEDSENSE chart shows a slightly bearish trend. Only 60.71% of the signals given by moving averages are bearish. This slightly bearish trend could turn neutral or reverse given the slightly bullish signals currently being given by short-term moving averages. An assessment of moving averages reveals several bearish and bullish signals:
Bearish trend reversal : Moving Average 50
Type : Bearish
Timeframe : Daily
Moving Average bullish crossovers : MA20 & MA50
Type : Bullish
Timeframe : Daily
Bullish price crossover with Moving Average 20
Type : Bullish
Timeframe : Daily
Bullish price crossover with Moving Average 50
Type : Bullish
Timeframe : Daily
In fact, only 8 technical indicators out of 18 studied are currently positioned bullish. But beware of excesses. The Central Indicators scanner currently detects this:
CCI indicator: bullish divergence
Type : Bullish
Timeframe : Daily
MACD indicator: bullish divergence
Type : Bullish
Timeframe : Daily
Williams %R indicator is overbought : over -20
Type : Neutral
Timeframe : Daily
Pivot points : price is over resistance 3
Type : Neutral
Timeframe : Daily
RSI indicator is back over 50
Type : Bullish
Timeframe : Daily
Momentum indicator is back over 0
Type : Bullish
Timeframe : Daily
The Central Patterns scanner, which studies chart patterns, resistances and supports, has identified this signal:
Near resistance of channel
Type : Bearish
Timeframe : Daily
No result was found by the Central Candlesticks scanner on Japanese candlesticks.
| S3 | S2 | S1 | Price | R1 | R2 | R3 | |
|---|---|---|---|---|---|---|---|
| ProTrendLines | 0.0657 | 0.1103 | 0.1280 | 0.1380 | 0.1428 | 0.1499 | 0.1691 |
| Change (%) | -52.39% | -20.07% | -7.25% | - | +3.48% | +8.62% | +22.54% |
| Change | -0.0723 | -0.0277 | -0.0100 | - | +0.0048 | +0.0119 | +0.0311 |
| Level | Minor | Major | Intermediate | - | Major | Intermediate | Major |
To determine price objectives, it is also possible to use the pivot points. Here is the price position in relation to pivot points:
| Pivot points | S3 | S2 | S1 | PP | R1 | R2 | R3 |
|---|---|---|---|---|---|---|---|
| Standard | 0.1290 | 0.1290 | 0.1290 | 0.1290 | 0.1290 | 0.1290 | 0.1290 |
| Camarilla | 0.1290 | 0.1290 | 0.1290 | 0.1290 | 0.1290 | 0.1290 | 0.1290 |
| Woodie | 0.1290 | 0.1290 | 0.1290 | 0.1290 | 0.1290 | 0.1290 | 0.1290 |
| Fibonacci | 0.1290 | 0.1290 | 0.1290 | 0.1290 | 0.1290 | 0.1290 | 0.1290 |
| Pivot points | S3 | S2 | S1 | PP | R1 | R2 | R3 |
|---|---|---|---|---|---|---|---|
| Standard | 0.1155 | 0.1205 | 0.1300 | 0.1350 | 0.1445 | 0.1495 | 0.1590 |
| Camarilla | 0.1355 | 0.1368 | 0.1382 | 0.1395 | 0.1408 | 0.1422 | 0.1435 |
| Woodie | 0.1178 | 0.1216 | 0.1323 | 0.1361 | 0.1468 | 0.1506 | 0.1613 |
| Fibonacci | 0.1205 | 0.1260 | 0.1295 | 0.1350 | 0.1405 | 0.1440 | 0.1495 |
| Pivot points | S3 | S2 | S1 | PP | R1 | R2 | R3 |
|---|---|---|---|---|---|---|---|
| Standard | 0.1022 | 0.1118 | 0.1257 | 0.1353 | 0.1492 | 0.1588 | 0.1727 |
| Camarilla | 0.1330 | 0.1352 | 0.1374 | 0.1395 | 0.1417 | 0.1438 | 0.1460 |
| Woodie | 0.1043 | 0.1129 | 0.1278 | 0.1364 | 0.1513 | 0.1599 | 0.1748 |
| Fibonacci | 0.1118 | 0.1208 | 0.1264 | 0.1353 | 0.1443 | 0.1499 | 0.1588 |
Numerical data
The following is the status of technical indicators and moving averages registered at the time this technical analysis was created:
| RSI (14): | 50.98 | |
| MACD (12,26,9): | -0.0007 | |
| Directional Movement: | -6.0684 | |
| AROON (14): | -21.4286 | |
| DEMA (21): | 0.1358 | |
| Parabolic SAR (0,02-0,02-0,2): | 0.1388 | |
| Elder Ray (13): | -0.0025 | |
| Super Trend (3,10): | 0.1465 | |
| Zig ZAG (10): | 0.1380 | |
| VORTEX (21): | 0.9740 | |
| Stochastique (14,3,5): | 72.97 | |
| TEMA (21): | 0.1355 | |
| Williams %R (14): | -10.81 | |
| Chande Momentum Oscillator (20): | 0.0040 | |
| Repulse (5,40,3): | 12.2916 | |
| ROCnROLL: | -1 | |
| TRIX (15,9): | -0.0517 | |
| Courbe Coppock: | 4.05 |
| MA7: | 0.1359 | |
| MA20: | 0.1373 | |
| MA50: | 0.1371 | |
| MA100: | 0.1399 | |
| MAexp7: | 0.1358 | |
| MAexp20: | 0.1366 | |
| MAexp50: | 0.1380 | |
| MAexp100: | 0.1422 | |
| Price / MA7: | +1.55% | |
| Price / MA20: | +0.51% | |
| Price / MA50: | +0.66% | |
| Price / MA100: | -1.36% | |
| Price / MAexp7: | +1.62% | |
| Price / MAexp20: | +1.02% | |
| Price / MAexp50: | -0% | |
| Price / MAexp100: | -2.95% |
About author
Online


Add a comment
Comments
0 comments on the analysis MKB NEDSENSE - Daily