UNILEVER - 1H - Technical analysis published on 07/18/2024 (GMT)
- 127
- 0
Click here for a new analysis!
- Timeframe : 1H
- - Analysis generated on
- Status : LEVEL MAINTAINED
Summary of the analysis

Additional analysis
Quotes
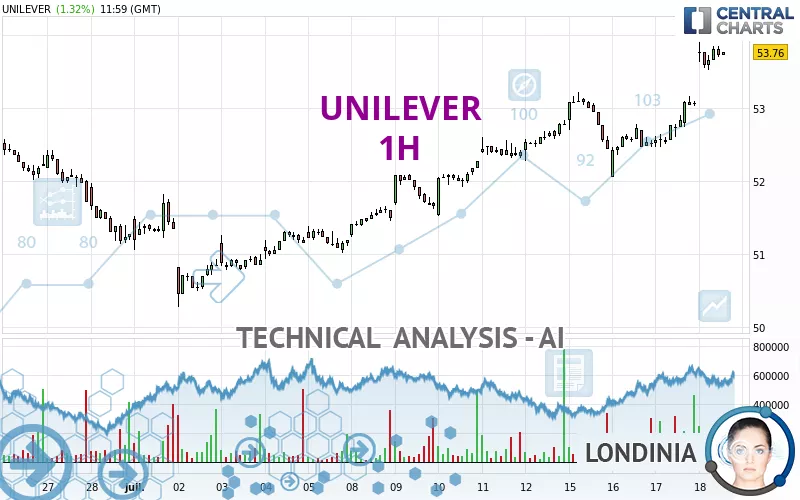
The UNILEVER price is 53.72 EUR. On the day, this instrument gained +1.24% with the lowest point at 53.52 EUR and the highest point at 53.90 EUR. The deviation from the price is +0.37% for the low point and -0.33% for the high point.The Central Gaps scanner detects the formation of a bullish gap marking the strong presence of buyers against sellers at the opening. This formed a quotation gap.
Opening Gap UP
Type : Bullish
Timeframe : Openning
A study of price movements over other periods shows the following variations:
New HIGH record (5 years)
Type : Bullish
Timeframe : Weekly
New HIGH record (1 year)
Type : Bullish
Timeframe : Weekly
New HIGH record (1st january)
Type : Bullish
Timeframe : Weekly
New HIGH record (1 month)
Type : Bullish
Timeframe : Weekly
Technical
Technical analysis of this 1H chart of UNILEVER indicates that the overall trend is strongly bullish. 92.86% of the signals given by moving averages are bullish. This strongly bullish trend is supported by the strong bullish signals given by short-term moving averages. The Central Indicators scanner does not detect any result on moving averages that would impact this trend.
Technical indicators are strongly bullish, suggesting that the price increase should continue.
Caution: the Central Indicators scanner currently detects an excess:
RSI indicator is overbought : over 70
Type : Neutral
Timeframe : 1 hour
CCI indicator is overbought : over 100
Type : Neutral
Timeframe : 1 hour
RSI indicator: bearish divergence
Type : Bearish
Timeframe : 1 hour
Williams %R indicator is overbought : over -20
Type : Neutral
Timeframe : 1 hour
Pivot points : price is over resistance 1
Type : Neutral
Timeframe : Weekly
Pivot points : price is over resistance 2
Type : Neutral
Timeframe : 1 hour
The Central Patterns scanner, which studies chart patterns, resistances and supports, has identified these signals:
Near horizontal resistance
Type : Bearish
Timeframe : 1 hour
Resistance of channel is broken
Type : Bullish
Timeframe : 1 hour
The Central Candlesticks scanner, specialised in Japanese candlesticks, did not identify any signals.
| S3 | S2 | S1 | Price | |
|---|---|---|---|---|
| ProTrendLines | 52.12 | 52.74 | 53.22 | 53.72 |
| Change (%) | -2.98% | -1.82% | -0.93% | - |
| Change | -1.60 | -0.98 | -0.50 | - |
| Level | Intermediate | Major | Intermediate | - |
Pivot points can also be used to set your price objectives. Here is the price situation in relation to pivot points:
| Pivot points | S3 | S2 | S1 | PP | R1 | R2 | R3 |
|---|---|---|---|---|---|---|---|
| Standard | 51.93 | 52.19 | 52.63 | 52.89 | 53.33 | 53.59 | 54.03 |
| Camarilla | 52.87 | 52.93 | 53.00 | 53.06 | 53.12 | 53.19 | 53.25 |
| Woodie | 52.01 | 52.24 | 52.71 | 52.94 | 53.41 | 53.64 | 54.11 |
| Fibonacci | 52.19 | 52.46 | 52.63 | 52.89 | 53.16 | 53.33 | 53.59 |
| Pivot points | S3 | S2 | S1 | PP | R1 | R2 | R3 |
|---|---|---|---|---|---|---|---|
| Standard | 50.13 | 50.69 | 51.73 | 52.29 | 53.33 | 53.89 | 54.93 |
| Camarilla | 52.34 | 52.49 | 52.63 | 52.78 | 52.93 | 53.07 | 53.22 |
| Woodie | 50.38 | 50.81 | 51.98 | 52.41 | 53.58 | 54.01 | 55.18 |
| Fibonacci | 50.69 | 51.30 | 51.68 | 52.29 | 52.90 | 53.28 | 53.89 |
| Pivot points | S3 | S2 | S1 | PP | R1 | R2 | R3 |
|---|---|---|---|---|---|---|---|
| Standard | 47.82 | 49.12 | 50.20 | 51.50 | 52.58 | 53.88 | 54.96 |
| Camarilla | 50.63 | 50.84 | 51.06 | 51.28 | 51.50 | 51.72 | 51.94 |
| Woodie | 47.71 | 49.07 | 50.09 | 51.45 | 52.47 | 53.83 | 54.85 |
| Fibonacci | 49.12 | 50.03 | 50.59 | 51.50 | 52.41 | 52.97 | 53.88 |
Numerical data
The following are the details of the technical indicators and moving averages that were collected to generate this technical analysis:
| RSI (14): | 70.99 | |
| MACD (12,26,9): | 0.3000 | |
| Directional Movement: | 31.33 | |
| AROON (14): | 71.43 | |
| DEMA (21): | 53.46 | |
| Parabolic SAR (0,02-0,02-0,2): | 52.92 | |
| Elder Ray (13): | 0.48 | |
| Super Trend (3,10): | 53.12 | |
| Zig ZAG (10): | 53.72 | |
| VORTEX (21): | 1.1600 | |
| Stochastique (14,3,5): | 87.50 | |
| TEMA (21): | 53.63 | |
| Williams %R (14): | -13.89 | |
| Chande Momentum Oscillator (20): | 1.12 | |
| Repulse (5,40,3): | -0.0900 | |
| ROCnROLL: | 1 | |
| TRIX (15,9): | 0.0500 | |
| Courbe Coppock: | 3.68 |
| MA7: | 52.73 | |
| MA20: | 52.01 | |
| MA50: | 51.35 | |
| MA100: | 48.42 | |
| MAexp7: | 53.52 | |
| MAexp20: | 53.12 | |
| MAexp50: | 52.74 | |
| MAexp100: | 52.39 | |
| Price / MA7: | +1.88% | |
| Price / MA20: | +3.29% | |
| Price / MA50: | +4.62% | |
| Price / MA100: | +10.95% | |
| Price / MAexp7: | +0.37% | |
| Price / MAexp20: | +1.13% | |
| Price / MAexp50: | +1.86% | |
| Price / MAexp100: | +2.54% |
About author
Online


Add a comment
Comments
0 comments on the analysis UNILEVER - 1H