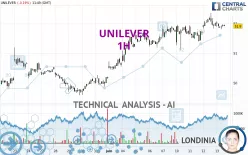
UNILEVER - 1H - Technical analysis published on 06/13/2024 (GMT)
- 170
- 0
Click here for a new analysis!
- Timeframe : 1H
- - Analysis generated on
- Status : TARGET REACHED

Summary of the analysis

Additional analysis
Quotes
The UNILEVER price is 51.96 EUR. The price registered a decrease of -0.08% on the session with the lowest point at 51.80 EUR and the highest point at 52.06 EUR. The deviation from the price is +0.31% for the low point and -0.19% for the high point.A bullish opening was detected by the Central Gaps scanner. Buyers are trying to impose a bullish momentum in the very short term.
Bullish opening
Type : Bullish
Timeframe : Openning
Here is a more detailed summary of the historical variations registered by UNILEVER:
New HIGH record (5 years)
Type : Bullish
Timeframe : Weekly
Near a new HIGH record (1 year)
Type : Bullish
Timeframe : Weekly
Near a new HIGH record (1st january)
Type : Bullish
Timeframe : Weekly
Near a new LOW record (1 month)
Type : Bearish
Timeframe : Weekly
Technical
A technical analysis in 1H of this UNILEVER chart shows a strongly bullish trend. The signals given by the moving averages are 92.86% bullish. This strong bullish trend is confirmed by the strong signals currently being given by short-term moving averages. There is no crossing of moving average by the price or crossing of moving averages between themselves.
In fact, Central Analyzer took into account 18 technical indicators and the result was as follows: 3 are bullish, 10 are neutral and 5 are bearish. But beware of excesses. The Central Indicators scanner currently detects this:
Williams %R indicator is oversold : under -80
Type : Neutral
Timeframe : 1 hour
The Central Patterns scanner, which studies chart patterns, resistances and supports, has identified this signal:
Near horizontal support
Type : Bullish
Timeframe : 1 hour
The presence of these Japanese chandelier patterns detected by Central Candlesticks that could impact the current short-term trend were also noted:
Black gravestone / inverted hammer
Type : Bearish
Timeframe : 1 hour
Doji
Type : Neutral
Timeframe : 1 hour
| S3 | S2 | S1 | Price | |
|---|---|---|---|---|
| ProTrendLines | 50.64 | 51.18 | 51.92 | 51.96 |
| Change (%) | -2.54% | -1.50% | -0.08% | - |
| Change | -1.32 | -0.78 | -0.04 | - |
| Level | Intermediate | Intermediate | Intermediate | - |
Pivot points can also be used to set your price objectives. Here is the price situation in relation to pivot points:
| Pivot points | S3 | S2 | S1 | PP | R1 | R2 | R3 |
|---|---|---|---|---|---|---|---|
| Standard | 51.25 | 51.53 | 51.77 | 52.05 | 52.29 | 52.57 | 52.81 |
| Camarilla | 51.86 | 51.91 | 51.95 | 52.00 | 52.05 | 52.10 | 52.14 |
| Woodie | 51.22 | 51.52 | 51.74 | 52.04 | 52.26 | 52.56 | 52.78 |
| Fibonacci | 51.53 | 51.73 | 51.86 | 52.05 | 52.25 | 52.38 | 52.57 |
| Pivot points | S3 | S2 | S1 | PP | R1 | R2 | R3 |
|---|---|---|---|---|---|---|---|
| Standard | 49.29 | 49.85 | 50.79 | 51.35 | 52.29 | 52.85 | 53.79 |
| Camarilla | 51.31 | 51.45 | 51.58 | 51.72 | 51.86 | 52.00 | 52.13 |
| Woodie | 49.47 | 49.95 | 50.97 | 51.45 | 52.47 | 52.95 | 53.97 |
| Fibonacci | 49.85 | 50.43 | 50.78 | 51.35 | 51.93 | 52.28 | 52.85 |
| Pivot points | S3 | S2 | S1 | PP | R1 | R2 | R3 |
|---|---|---|---|---|---|---|---|
| Standard | 44.90 | 46.36 | 48.26 | 49.72 | 51.62 | 53.08 | 54.98 |
| Camarilla | 49.24 | 49.54 | 49.85 | 50.16 | 50.47 | 50.78 | 51.08 |
| Woodie | 45.12 | 46.47 | 48.48 | 49.83 | 51.84 | 53.19 | 55.20 |
| Fibonacci | 46.36 | 47.64 | 48.44 | 49.72 | 51.00 | 51.80 | 53.08 |
Numerical data
The following is the status of technical indicators and moving averages registered at the time this technical analysis was created:
| RSI (14): | 52.13 | |
| MACD (12,26,9): | 0.0700 | |
| Directional Movement: | 4.33 | |
| AROON (14): | 42.86 | |
| DEMA (21): | 51.98 | |
| Parabolic SAR (0,02-0,02-0,2): | 52.30 | |
| Elder Ray (13): | 0.01 | |
| Super Trend (3,10): | 51.63 | |
| Zig ZAG (10): | 51.88 | |
| VORTEX (21): | 1.0500 | |
| Stochastique (14,3,5): | 33.49 | |
| TEMA (21): | 51.95 | |
| Williams %R (14): | -85.19 | |
| Chande Momentum Oscillator (20): | -0.14 | |
| Repulse (5,40,3): | -0.0500 | |
| ROCnROLL: | -1 | |
| TRIX (15,9): | 0.0200 | |
| Courbe Coppock: | 0.85 |
| MA7: | 51.73 | |
| MA20: | 50.81 | |
| MA50: | 48.19 | |
| MA100: | 46.70 | |
| MAexp7: | 51.92 | |
| MAexp20: | 51.88 | |
| MAexp50: | 51.67 | |
| MAexp100: | 51.28 | |
| Price / MA7: | +0.44% | |
| Price / MA20: | +2.26% | |
| Price / MA50: | +7.82% | |
| Price / MA100: | +11.26% | |
| Price / MAexp7: | +0.08% | |
| Price / MAexp20: | +0.15% | |
| Price / MAexp50: | +0.56% | |
| Price / MAexp100: | +1.33% |
About author
Online


Add a comment
Comments
0 comments on the analysis UNILEVER - 1H