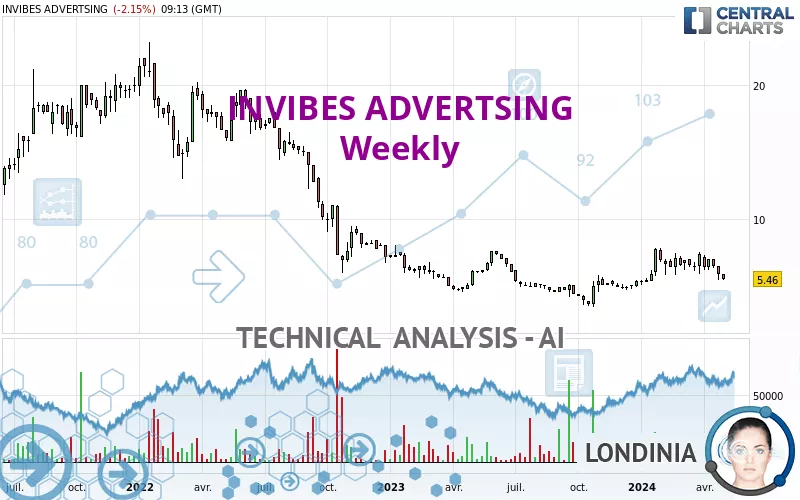
INVIBES ADVERTSING - Weekly - Technical analysis published on 05/03/2024 (GMT)
- 163
- 0
Click here for a new analysis!
- Timeframe : Weekly
- - Analysis generated on
- Status : TARGET REACHED

Summary of the analysis

Additional analysis
Quotes
The INVIBES ADVERTSING price is 5.46 EUR. The price registered a decrease of -7.14% over 5 days and has been traded over the last 5 days between 5.44 EUR and 5.86 EUR. This implies that the 5 day price is +0.37% from its lowest point and -6.83% from its highest point.A bearish gap was detected at the opening by the Central Gaps scanner. There are a lot of sellers and they have the upper hand in the very short term.
Opening Gap DOWN
Type : Bearish
Timeframe : Openning
A study of price movements over other periods shows the following variations:
New LOW record (1 month)
Type : Bearish
Timeframe : Weekly
Technical
Technical analysis of this Weekly chart of INVIBES ADVERTSING indicates that the overall trend is strongly bearish. 85.71% of the signals given by moving averages are bearish. The slightly bearish signals from short-term moving averages show that the overall trend is slowing down. An assessment of moving averages reveals several bearish signals that could impact this trend:
Bearish trend reversal : Moving Average 50
Type : Bearish
Timeframe : Weekly
Bearish trend reversal : adaptative moving average 20
Type : Bearish
Timeframe : Weekly
Bearish trend reversal : adaptative moving average 50
Type : Bearish
Timeframe : Weekly
Bearish price crossover with Moving Average 50
Type : Bearish
Timeframe : Weekly
Bearish price crossover with adaptative moving average 50
Type : Bearish
Timeframe : Weekly
Technical indicators are bearish. There is still some doubt about the decline in the price.
But beware of excesses. The Central Indicators scanner currently detects this:
Williams %R indicator is oversold : under -80
Type : Neutral
Timeframe : Weekly
Aroon indicator bearish trend
Type : Bearish
Timeframe : Weekly
An analysis of the price chart with the Central Patterns scanner (detector of chart patterns and resistances and supports) shows several results that can have an impact on the price change:
Near horizontal resistance
Type : Bearish
Timeframe : Weekly
Near support of channel
Type : Bullish
Timeframe : Weekly
No result was found by the Central Candlesticks scanner on Japanese candlesticks.
| S1 | Price | R1 | R2 | R3 | |
|---|---|---|---|---|---|
| ProTrendLines | 3.40 | 5.46 | 5.63 | 7.73 | 11.07 |
| Change (%) | -37.73% | - | +3.11% | +41.58% | +102.75% |
| Change | -2.06 | - | +0.17 | +2.27 | +5.61 |
| Level | Intermediate | - | Major | Intermediate | Minor |
To determine price objectives, it is also possible to use the pivot points. Here is the price position in relation to pivot points:
| Pivot points | S3 | S2 | S1 | PP | R1 | R2 | R3 |
|---|---|---|---|---|---|---|---|
| Standard | 5.53 | 5.55 | 5.57 | 5.59 | 5.61 | 5.63 | 5.65 |
| Camarilla | 5.57 | 5.57 | 5.58 | 5.58 | 5.58 | 5.59 | 5.59 |
| Woodie | 5.52 | 5.55 | 5.56 | 5.59 | 5.60 | 5.63 | 5.64 |
| Fibonacci | 5.55 | 5.57 | 5.58 | 5.59 | 5.61 | 5.62 | 5.63 |
| Pivot points | S3 | S2 | S1 | PP | R1 | R2 | R3 |
|---|---|---|---|---|---|---|---|
| Standard | 4.32 | 4.88 | 5.38 | 5.94 | 6.44 | 7.00 | 7.50 |
| Camarilla | 5.59 | 5.69 | 5.78 | 5.88 | 5.98 | 6.07 | 6.17 |
| Woodie | 4.29 | 4.87 | 5.35 | 5.93 | 6.41 | 6.99 | 7.47 |
| Fibonacci | 4.88 | 5.29 | 5.54 | 5.94 | 6.35 | 6.60 | 7.00 |
| Pivot points | S3 | S2 | S1 | PP | R1 | R2 | R3 |
|---|---|---|---|---|---|---|---|
| Standard | 3.09 | 4.27 | 4.97 | 6.15 | 6.85 | 8.03 | 8.73 |
| Camarilla | 5.16 | 5.34 | 5.51 | 5.68 | 5.85 | 6.03 | 6.20 |
| Woodie | 2.86 | 4.15 | 4.74 | 6.03 | 6.62 | 7.91 | 8.50 |
| Fibonacci | 4.27 | 4.99 | 5.43 | 6.15 | 6.87 | 7.31 | 8.03 |
Numerical data
The following are the details of the technical indicators and moving averages that were collected to generate this technical analysis:
| RSI (14): | 44.66 | |
| MACD (12,26,9): | 0.1800 | |
| Directional Movement: | -2.80 | |
| AROON (14): | -92.86 | |
| DEMA (21): | 6.49 | |
| Parabolic SAR (0,02-0,02-0,2): | 7.56 | |
| Elder Ray (13): | -0.65 | |
| Super Trend (3,10): | 5.13 | |
| Zig ZAG (10): | 5.46 | |
| VORTEX (21): | 1.0400 | |
| Stochastique (14,3,5): | 22.22 | |
| TEMA (21): | 6.63 | |
| Williams %R (14): | -99.15 | |
| Chande Momentum Oscillator (20): | -1.14 | |
| Repulse (5,40,3): | -15.7600 | |
| ROCnROLL: | 2 | |
| TRIX (15,9): | 0.9200 | |
| Courbe Coppock: | 16.52 |
| MA7: | 5.85 | |
| MA20: | 6.35 | |
| MA50: | 6.54 | |
| MA100: | 6.20 | |
| MAexp7: | 6.23 | |
| MAexp20: | 6.21 | |
| MAexp50: | 6.32 | |
| MAexp100: | 7.57 | |
| Price / MA7: | -6.67% | |
| Price / MA20: | -14.02% | |
| Price / MA50: | -16.51% | |
| Price / MA100: | -11.94% | |
| Price / MAexp7: | -12.36% | |
| Price / MAexp20: | -12.08% | |
| Price / MAexp50: | -13.61% | |
| Price / MAexp100: | -27.87% |
News
The last news published on INVIBES ADVERTSING at the time of the generation of this analysis was as follows:
- Invibes Advertising : 2024/2025 financial agenda.
- Invibes Advertising : 2024/2025 financial agenda.
- Invibes Advertising : 6% growth in Q1 2024 sales.
- Invibes Advertising : 6% growth in Q1 2024 sales.
- Invibes Advertising : Strong growth in annual results 2023.
About author

Online


Add a comment
Comments
0 comments on the analysis INVIBES ADVERTSING - Weekly