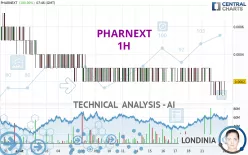
PHARNEXT - 1H - Technical analysis published on 08/23/2023 (GMT)
- 253
- 0
- Timeframe : 1H
- - Analysis generated on
- Status : NEUTRAL

Summary of the analysis
Additional analysis
Quotes
The PHARNEXT price is 0.0002 EUR. The price has increased by +100.00% since the last closing and was between 0.0001 EUR and 0.0002 EUR. This implies that the price is at +100.00% from its lowest and at 0% from its highest.A bullish opening was detected by the Central Gaps scanner. Buyers are trying to impose a bullish momentum in the very short term.
Bullish opening
Type : Bullish
Timeframe : Openning
Here is a more detailed summary of the historical variations registered by PHARNEXT:
New LOW record (5 years)
Type : Bearish
Timeframe : Weekly
New LOW record (1 year)
Type : Bearish
Timeframe : Weekly
New LOW record (1st january)
Type : Bearish
Timeframe : Weekly
New LOW record (1 month)
Type : Bearish
Timeframe : Weekly
The Central Volumes scanner detects abnormal volumes on the asset:
Abnormal volumes
Timeframe : 5 days
Abnormal volumes
Timeframe : 20 days
Abnormal volumes
Timeframe : 50 days
Technical
Technical analysis of this 1H chart of PHARNEXT indicates that the overall trend is not clearly defined. This generally neutral trend is confirmed by the neutral signals currently given by short-term moving averages. The Central Indicators market scanner currently does not detect any result that concerns moving averages.
In fact, Central Analyzer took into account 18 technical indicators and the result was as follows: 6 are bullish, 10 are neutral and 2 are bearish. Caution: the Central Indicators scanner currently detects an excess:
CCI indicator: bullish divergence
Type : Bullish
Timeframe : 1 hour
Price is back under the pivot point
Type : Bearish
Timeframe : Weekly
The analysis of the price chart with Central Patterns scanners does not return any result.
There is also a Japanese candlestick pattern detected by Central Candlesticks that could mark the end of the current short-term trend:
Doji
Type : Neutral
Timeframe : 1 hour
| Price | R1 | R2 | R3 | |
|---|---|---|---|---|
| ProTrendLines | 0.0002 | 0.0003 | 0.0006 | 0.0010 |
| Change (%) | - | +50.00% | +200.00% | +400.00% |
| Change | - | +0.0001 | +0.0004 | +0.0008 |
| Level | - | Major | Minor | Minor |
Pivot points can also be used to set your price objectives. Here is the price situation in relation to pivot points:
| Pivot points | S3 | S2 | S1 | PP | R1 | R2 | R3 |
|---|---|---|---|---|---|---|---|
| Standard | -0.0002 | 0.0000 | 0.0000 | 0.0002 | 0.0002 | 0.0004 | 0.0004 |
| Camarilla | 0.0001 | 0.0001 | 0.0001 | 0.0001 | 0.0001 | 0.0001 | 0.0002 |
| Woodie | -0.0002 | -0.0001 | 0.0000 | 0.0002 | 0.0002 | 0.0004 | 0.0004 |
| Fibonacci | 0.0000 | 0.0000 | 0.0001 | 0.0002 | 0.0002 | 0.0003 | 0.0004 |
| Pivot points | S3 | S2 | S1 | PP | R1 | R2 | R3 |
|---|---|---|---|---|---|---|---|
| Standard | 0.0001 | 0.0001 | 0.0002 | 0.0002 | 0.0003 | 0.0003 | 0.0004 |
| Camarilla | 0.0002 | 0.0002 | 0.0002 | 0.0002 | 0.0002 | 0.0002 | 0.0002 |
| Woodie | 0.0001 | 0.0001 | 0.0002 | 0.0002 | 0.0003 | 0.0003 | 0.0004 |
| Fibonacci | 0.0001 | 0.0002 | 0.0002 | 0.0002 | 0.0003 | 0.0003 | 0.0003 |
| Pivot points | S3 | S2 | S1 | PP | R1 | R2 | R3 |
|---|---|---|---|---|---|---|---|
| Standard | -0.0390 | -0.0193 | -0.0094 | 0.0103 | 0.0202 | 0.0399 | 0.0498 |
| Camarilla | -0.0076 | -0.0049 | -0.0022 | 0.0005 | 0.0032 | 0.0059 | 0.0086 |
| Woodie | -0.0439 | -0.0218 | -0.0143 | 0.0079 | 0.0153 | 0.0375 | 0.0449 |
| Fibonacci | -0.0193 | -0.0080 | -0.0010 | 0.0103 | 0.0216 | 0.0286 | 0.0399 |
Numerical data
The following is the status of technical indicators and moving averages registered at the time this technical analysis was created:
| RSI (14): | 49.80 | |
| MACD (12,26,9): | 0.0000 | |
| Directional Movement: | -9.5712 | |
| AROON (14): | -35.7143 | |
| DEMA (21): | 0.0002 | |
| Parabolic SAR (0,02-0,02-0,2): | 0.0002 | |
| Elder Ray (13): | -0.0001 | |
| Super Trend (3,10): | 0.0003 | |
| Zig ZAG (10): | 0.0002 | |
| VORTEX (21): | 0.7647 | |
| Stochastique (14,3,5): | 33.33 | |
| TEMA (21): | 0.0002 | |
| Williams %R (14): | -50.00 | |
| Chande Momentum Oscillator (20): | -0.0001 | |
| Repulse (5,40,3): | -2.3155 | |
| ROCnROLL: | -1 | |
| TRIX (15,9): | -0.9673 | |
| Courbe Coppock: | 58.18 |
| MA7: | 0.0002 | |
| MA20: | 0.0003 | |
| MA50: | 0.0122 | |
| MA100: | 0.7547 | |
| MAexp7: | 0.0002 | |
| MAexp20: | 0.0002 | |
| MAexp50: | 0.0002 | |
| MAexp100: | 0.0003 | |
| Price / MA7: | -0% | |
| Price / MA20: | -33.33% | |
| Price / MA50: | -98.36% | |
| Price / MA100: | -99.97% | |
| Price / MAexp7: | -0% | |
| Price / MAexp20: | -0% | |
| Price / MAexp50: | -0% | |
| Price / MAexp100: | -33.33% |
News
The latest news and videos published on PHARNEXT at the time of the analysis were as follows:
- Balance sheet liabilities reduced by almost EUR8 million following a debt waiver
- Pharnext shareholders approve the appointment of Guy-Charles Fanneau de La Horie to the Supervisory Board
- Pharnext appoints Gilbert Wagener, M.D., Ph.D. as Chief Medical Officer
- The Latest Findings From CMTMe, a 'Real-World' Digital Lifestyle Study on Charcot-Marie-Tooth Diseases ('CMTs'), to be Presented at the 2023 Peripheral Nerve Society ('PNS') Annual Meeting
- Pharnext supports and participates in the First European Charcot-Marie-Tooth disease Specialists Conference
About author

Online


Add a comment
Comments
0 comments on the analysis PHARNEXT - 1H