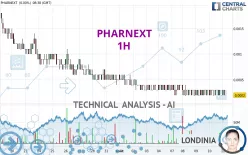
PHARNEXT - 1H - Technical analysis published on 08/11/2023 (GMT)
- 293
- 0
- Timeframe : 1H
- - Analysis generated on
- Status : NEUTRAL

Summary of the analysis
Additional analysis
Quotes
The PHARNEXT rating is 0.0003 EUR. The price registered an increase of +50.00% on the session with the lowest point at 0.0002 EUR and the highest point at 0.0003 EUR. The deviation from the price is +50.00% for the low point and 0% for the high point.So that you have an overall view of the price change, here is a table showing the variations over several periods:
New LOW record (5 years)
Type : Bearish
Timeframe : Weekly
New LOW record (1 year)
Type : Bearish
Timeframe : Weekly
New LOW record (1st january)
Type : Bearish
Timeframe : Weekly
New LOW record (1 month)
Type : Bearish
Timeframe : Weekly
Abnormal volumes on PHARNEXT were detected by the Central Volumes scanner:
Abnormal volumes
Timeframe : 5 days
Abnormal volumes
Timeframe : 20 days
Abnormal volumes
Timeframe : 50 days
Technical
A technical analysis in 1H of this PHARNEXT chart shows a slightly bearish trend. 50.00% of the signals given by moving averages are bullish. As the signals currently given by short-term moving averages are rather neutral, the overall trend could quickly return to neutral as well. There is no crossing of moving average by the price or crossing of moving averages between themselves.
The probability of a further increase is slight given the direction of the technical indicators.
Caution: the Central Indicators scanner currently detects an excess:
Williams %R indicator is overbought : over -20
Type : Neutral
Timeframe : 1 hour
Pivot points : price is over resistance 1
Type : Neutral
Timeframe : 1 hour
Central Patterns, the scanner specializing in chart patterns, did not identify any signals.
Central Candlesticks, the scanner specialised in Japanese candlesticks, detects this inversion signal that could impact the current short-term trend:
Doji
Type : Neutral
Timeframe : 1 hour
| Price | R1 | R2 | R3 | |
|---|---|---|---|---|
| ProTrendLines | 0.0003 | 0.0004 | 0.0025 | 0.0045 |
| Change (%) | - | +33.33% | +733.33% | +1,400.00% |
| Change | - | +0.0001 | +0.0022 | +0.0042 |
| Level | - | Major | Minor | Minor |
Attention could also be paid to pivot points to set price objectives:
| Pivot points | S3 | S2 | S1 | PP | R1 | R2 | R3 |
|---|---|---|---|---|---|---|---|
| Standard | 0.0001 | 0.0001 | 0.0002 | 0.0002 | 0.0003 | 0.0003 | 0.0004 |
| Camarilla | 0.0002 | 0.0002 | 0.0002 | 0.0002 | 0.0002 | 0.0002 | 0.0002 |
| Woodie | 0.0001 | 0.0001 | 0.0002 | 0.0002 | 0.0003 | 0.0003 | 0.0004 |
| Fibonacci | 0.0001 | 0.0002 | 0.0002 | 0.0002 | 0.0003 | 0.0003 | 0.0003 |
| Pivot points | S3 | S2 | S1 | PP | R1 | R2 | R3 |
|---|---|---|---|---|---|---|---|
| Standard | -0.0001 | 0.0001 | 0.0002 | 0.0004 | 0.0005 | 0.0007 | 0.0008 |
| Camarilla | 0.0002 | 0.0003 | 0.0003 | 0.0003 | 0.0003 | 0.0004 | 0.0004 |
| Woodie | -0.0002 | 0.0001 | 0.0002 | 0.0004 | 0.0005 | 0.0007 | 0.0008 |
| Fibonacci | 0.0001 | 0.0002 | 0.0003 | 0.0004 | 0.0005 | 0.0006 | 0.0007 |
| Pivot points | S3 | S2 | S1 | PP | R1 | R2 | R3 |
|---|---|---|---|---|---|---|---|
| Standard | -0.0390 | -0.0193 | -0.0094 | 0.0103 | 0.0202 | 0.0399 | 0.0498 |
| Camarilla | -0.0076 | -0.0049 | -0.0022 | 0.0005 | 0.0032 | 0.0059 | 0.0086 |
| Woodie | -0.0439 | -0.0218 | -0.0143 | 0.0079 | 0.0153 | 0.0375 | 0.0449 |
| Fibonacci | -0.0193 | -0.0080 | -0.0010 | 0.0103 | 0.0216 | 0.0286 | 0.0399 |
Numerical data
The following are the details of the technical indicators and moving averages that were collected to generate this technical analysis:
| RSI (14): | 51.98 | |
| MACD (12,26,9): | 0.0000 | |
| Directional Movement: | -3.5038 | |
| AROON (14): | 0 | |
| DEMA (21): | 0.0003 | |
| Parabolic SAR (0,02-0,02-0,2): | 0.0003 | |
| Elder Ray (13): | -0.0001 | |
| Super Trend (3,10): | 0.0005 | |
| Zig ZAG (10): | 0.0003 | |
| VORTEX (21): | 0.9000 | |
| Stochastique (14,3,5): | 66.67 | |
| TEMA (21): | 0.0003 | |
| Williams %R (14): | 0.00 | |
| Chande Momentum Oscillator (20): | 0.0000 | |
| Repulse (5,40,3): | 51.4800 | |
| ROCnROLL: | -1 | |
| TRIX (15,9): | -0.5191 | |
| Courbe Coppock: | 21.82 |
| MA7: | 0.0003 | |
| MA20: | 0.0007 | |
| MA50: | 0.0297 | |
| MA100: | 1.0047 | |
| MAexp7: | 0.0003 | |
| MAexp20: | 0.0003 | |
| MAexp50: | 0.0003 | |
| MAexp100: | 0.0007 | |
| Price / MA7: | -0% | |
| Price / MA20: | -57.14% | |
| Price / MA50: | -98.99% | |
| Price / MA100: | -99.97% | |
| Price / MAexp7: | -0% | |
| Price / MAexp20: | -0% | |
| Price / MAexp50: | -0% | |
| Price / MAexp100: | -57.14% |
News
The last news published on PHARNEXT at the time of the generation of this analysis was as follows:
- Balance sheet liabilities reduced by almost EUR8 million following a debt waiver
- Pharnext shareholders approve the appointment of Guy-Charles Fanneau de La Horie to the Supervisory Board
- Pharnext appoints Gilbert Wagener, M.D., Ph.D. as Chief Medical Officer
- The Latest Findings From CMTMe, a 'Real-World' Digital Lifestyle Study on Charcot-Marie-Tooth Diseases ('CMTs'), to be Presented at the 2023 Peripheral Nerve Society ('PNS') Annual Meeting
- Pharnext supports and participates in the First European Charcot-Marie-Tooth disease Specialists Conference
About author

Online


Add a comment
Comments
0 comments on the analysis PHARNEXT - 1H