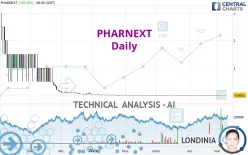
PHARNEXT - Daily - Technical analysis published on 05/09/2023 (GMT)
- 185
- 0
Click here for a new analysis!
- Timeframe : Daily
- - Analysis generated on
- Status : TARGET REACHED

Summary of the analysis
Additional analysis
Quotes
PHARNEXT rating 0.0002 EUR. The price has increased by +100.00% since the last closing and was traded between 0.0001 EUR and 0.0002 EUR over the period. The price is currently at +100.00% from its lowest and 0% from its highest.Here is a more detailed summary of the historical variations registered by PHARNEXT:
New LOW record (5 years)
Type : Bearish
Timeframe : Weekly
New LOW record (1 year)
Type : Bearish
Timeframe : Weekly
New LOW record (1st january)
Type : Bearish
Timeframe : Weekly
New LOW record (1 month)
Type : Bearish
Timeframe : Weekly
Abnormal volumes on PHARNEXT were detected by the Central Volumes scanner:
Abnormal volumes
Timeframe : 5 days
Abnormal volumes
Timeframe : 20 days
Abnormal volumes
Timeframe : 50 days
Technical
Technical analysis of PHARNEXT in Daily shows a overall strongly bearish trend. 85.71% of the signals given by moving averages are bearish. The slightly bearish signals from short-term moving averages show that the overall trend is slowing down. The Central Indicators scanner does not detect any result on moving averages that would impact this trend.
An assessment of technical indicators does not currently provide any relevant information to suggest whether the signal given by the technical indicators is more bullish or bearish.
Caution: the Central Indicators scanner currently detects an excess:
RSI indicator: bullish divergence
Type : Bullish
Timeframe : Daily
Pivot points : price is over resistance 1
Type : Neutral
Timeframe : Daily
Price is back over the pivot point
Type : Bullish
Timeframe : Weekly
No signals are given by Central Patterns, a market scanner specialised in chart patterns, resistances and supports.
The Central Candlesticks scanner which studies Japanese candlesticks did not detect anything.
| Price | R1 | R2 | R3 | |
|---|---|---|---|---|
| ProTrendLines | 0.0002 | 3.5000 | 9.0000 | 11.0000 |
| Change (%) | - | +1,749,900.00% | +4,499,900.00% | +5,499,900.00% |
| Change | - | +3.4998 | +8.9998 | +10.9998 |
| Level | - | Intermediate | Minor | Minor |
Attention could also be paid to pivot points to set price objectives:
| Pivot points | S3 | S2 | S1 | PP | R1 | R2 | R3 |
|---|---|---|---|---|---|---|---|
| Standard | 0.0000 | 0.0000 | 0.0001 | 0.0001 | 0.0002 | 0.0002 | 0.0003 |
| Camarilla | 0.0001 | 0.0001 | 0.0001 | 0.0001 | 0.0001 | 0.0001 | 0.0001 |
| Woodie | -0.0001 | 0.0000 | 0.0001 | 0.0001 | 0.0002 | 0.0002 | 0.0003 |
| Fibonacci | 0.0000 | 0.0001 | 0.0001 | 0.0001 | 0.0002 | 0.0002 | 0.0002 |
| Pivot points | S3 | S2 | S1 | PP | R1 | R2 | R3 |
|---|---|---|---|---|---|---|---|
| Standard | 0.0000 | 0.0001 | 0.0001 | 0.0002 | 0.0002 | 0.0003 | 0.0003 |
| Camarilla | 0.0002 | 0.0002 | 0.0002 | 0.0002 | 0.0002 | 0.0002 | 0.0002 |
| Woodie | 0.0001 | 0.0001 | 0.0002 | 0.0002 | 0.0003 | 0.0003 | 0.0004 |
| Fibonacci | 0.0001 | 0.0001 | 0.0001 | 0.0002 | 0.0002 | 0.0002 | 0.0003 |
| Pivot points | S3 | S2 | S1 | PP | R1 | R2 | R3 |
|---|---|---|---|---|---|---|---|
| Standard | -0.0002 | -0.0001 | 0.0001 | 0.0002 | 0.0004 | 0.0005 | 0.0007 |
| Camarilla | 0.0001 | 0.0002 | 0.0002 | 0.0002 | 0.0002 | 0.0003 | 0.0003 |
| Woodie | -0.0003 | -0.0001 | 0.0001 | 0.0002 | 0.0004 | 0.0005 | 0.0007 |
| Fibonacci | -0.0001 | 0.0001 | 0.0001 | 0.0002 | 0.0004 | 0.0004 | 0.0005 |
Numerical data
The following are the details of the technical indicators and moving averages that were collected to generate this technical analysis:
| RSI (14): | 38.14 | |
| MACD (12,26,9): | -0.0003 | |
| Directional Movement: | -11.1884 | |
| AROON (14): | -28.5714 | |
| DEMA (21): | 0.0002 | |
| Parabolic SAR (0,02-0,02-0,2): | 0.0004 | |
| Elder Ray (13): | -0.0001 | |
| Super Trend (3,10): | 0.0005 | |
| Zig ZAG (10): | 0.0002 | |
| VORTEX (21): | 0.9167 | |
| Stochastique (14,3,5): | 27.78 | |
| TEMA (21): | 0.0012 | |
| Williams %R (14): | -50.00 | |
| Chande Momentum Oscillator (20): | -0.0001 | |
| Repulse (5,40,3): | 40.9526 | |
| ROCnROLL: | -1 | |
| TRIX (15,9): | -4.5905 | |
| Courbe Coppock: | 75.91 |
| MA7: | 0.0002 | |
| MA20: | 0.0002 | |
| MA50: | 0.0004 | |
| MA100: | 0.0078 | |
| MAexp7: | 0.0002 | |
| MAexp20: | 0.0003 | |
| MAexp50: | 0.0313 | |
| MAexp100: | 1.0719 | |
| Price / MA7: | -0% | |
| Price / MA20: | -0% | |
| Price / MA50: | -50.00% | |
| Price / MA100: | -97.44% | |
| Price / MAexp7: | -0% | |
| Price / MAexp20: | -33.33% | |
| Price / MAexp50: | -99.36% | |
| Price / MAexp100: | -99.98% |
News
The last news published on PHARNEXT at the time of the generation of this analysis was as follows:
- Pharnext supports the online 2023 Conference of CMTUK, the UK's Charity dedicated to supporting people living with Charcot-Marie-Tooth disease
- Findings on the impact of fatigue on patients living with Charcot-Marie-Tooth diseases from 'Real-World' digital lifestyle study, CMT and Me, to be presented in a webinar organized with CMT UK
- Pharnext supports and participates in two congresses on Neuromuscular Disorders in Europe
- Pharnext supports and participates in two congresses dedicated to Charcot-Marie-Tooth diseases in Marseille, France
- New study published by Edison Investment Research updates valuation of Pharnext's assets
About author

Online


Add a comment
Comments
0 comments on the analysis PHARNEXT - Daily