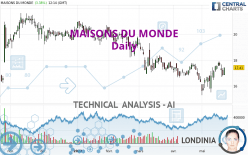
MAISONS DU MONDE - Daily - Technical analysis published on 05/23/2022 (GMT)
- 228
- 0
- Timeframe : Daily
- - Analysis generated on
- Status : NEUTRAL

Summary of the analysis
Trends
Short term:
Bullish
Underlying:
Slightly bearish
Technical indicators
61%
6%
33%
My opinion
Neutral between 16.77 EUR and 18.16 EUR
My targets
-
My analysis
The basic trend is slightly bearish and the short term is tentatively bullish. With such a pattern, it is difficult to favour buying or selling. The first resistance is located at 18.16 EUR. The first support is located at 16.77 EUR. Without a basic trend, it is be important to monitor the price reaction at the first levels of resistance or support. A bullish break in resistance could quickly reverse the basic trend. A bearish break in the support would be welcome to boost the slightly bearish basic trend. On the other hand, if the price is blocked by resistance or support, it could be attractive to trade against the trend on the last short-term movement registered by MAISONS DU MONDE.
In the very short term, technical indicators are bullish and could soon allow change to a bullish sentiment.
Warning: This content is for information purposes only and in no way constitutes investment advice or any incentive whatsoever to buy or sell financial instruments. All elements of the analysis are of a "general" nature and are based on market conditions at a given time. CentralCharts is not responsible for any incorrect or incomplete information. Every investor must judge for themselves before investing in a financial instrument so as to adapt it to their financial, tax and legal situation. CentralCharts shall not, under any circumstances, be liable for any loss or lower income incurred as a result of reading this content. Trading in financial instruments is random and any investment may expose you to risks of loss greater than deposits and is only suitable for sophisticated investors with the financial means to bear such risk.

This analysis was given by Vincent Launay. Take part yourself by sharing additional analysis on another time unit:
Additional analysis
Quotes
MAISONS DU MONDE rating 17.41 EUR. The price has increased by +3.39% since the last closing and was traded between 16.84 EUR and 17.41 EUR over the period. The price is currently at +3.38% from its lowest and 0% from its highest.16.84
17.41
17.41
So that you have an overall view of the price change, here is a table showing the variations over several periods:
Near a new HIGH record (1 month)
Type : Bullish
Timeframe : Weekly
Technical
Technical analysis of this Daily chart of MAISONS DU MONDE indicates that the overall trend is slightly bearish. 60.71% of the signals given by moving averages are bearish. Caution: the slightly bullish signals currently given by short-term moving averages could cause a reversal of the trend. The Central Indicators scanner detects bullish signals on moving averages that could impact this trend:
Bullish price crossover with Moving Average 20
Type : Bullish
Timeframe : Daily
Bullish price crossover with Moving Average 50
Type : Bullish
Timeframe : Daily
Bullish price crossover with adaptative moving average 20
Type : Bullish
Timeframe : Daily
Bullish price crossover with adaptative moving average 50
Type : Bullish
Timeframe : Daily
The probability of a further increase are moderate given the direction of the technical indicators.
But beware of excesses. The Central Indicators scanner currently detects this:
Williams %R indicator is overbought : over -20
Type : Neutral
Timeframe : Daily
Pivot points : price is over resistance 1
Type : Neutral
Timeframe : Daily
RSI indicator is back over 50
Type : Bullish
Timeframe : Daily
Price is back over the pivot point
Type : Bullish
Timeframe : Weekly
The analysis of the price chart with Central Patterns scanners does not return any result.
The Central Candlesticks scanner which studies Japanese candlesticks did not detect anything.
ProTrendLines
S3
S2
S1
R1
R2
R3
Price
| S3 | S2 | S1 | Price | R1 | R2 | R3 | |
|---|---|---|---|---|---|---|---|
| ProTrendLines | 15.63 | 16.19 | 16.77 | 17.41 | 17.64 | 18.16 | 19.61 |
| Change (%) | -10.22% | -7.01% | -3.68% | - | +1.32% | +4.31% | +12.64% |
| Change | -1.78 | -1.22 | -0.64 | - | +0.23 | +0.75 | +2.20 |
| Level | Major | Major | Intermediate | - | Intermediate | Minor | Intermediate |
Attention could also be paid to pivot points to set price objectives:
Daily
| Pivot points | S3 | S2 | S1 | PP | R1 | R2 | R3 |
|---|---|---|---|---|---|---|---|
| Standard | 16.00 | 16.37 | 16.61 | 16.98 | 17.22 | 17.59 | 17.83 |
| Camarilla | 16.67 | 16.73 | 16.78 | 16.84 | 16.90 | 16.95 | 17.01 |
| Woodie | 15.93 | 16.34 | 16.54 | 16.95 | 17.15 | 17.56 | 17.76 |
| Fibonacci | 16.37 | 16.61 | 16.75 | 16.98 | 17.22 | 17.36 | 17.59 |
Weekly
| Pivot points | S3 | S2 | S1 | PP | R1 | R2 | R3 |
|---|---|---|---|---|---|---|---|
| Standard | 15.26 | 15.99 | 16.41 | 17.14 | 17.56 | 18.29 | 18.71 |
| Camarilla | 16.52 | 16.63 | 16.74 | 16.84 | 16.95 | 17.05 | 17.16 |
| Woodie | 15.12 | 15.91 | 16.27 | 17.06 | 17.42 | 18.21 | 18.57 |
| Fibonacci | 15.99 | 16.43 | 16.70 | 17.14 | 17.58 | 17.85 | 18.29 |
Monthly
| Pivot points | S3 | S2 | S1 | PP | R1 | R2 | R3 |
|---|---|---|---|---|---|---|---|
| Standard | 14.34 | 15.31 | 15.82 | 16.79 | 17.30 | 18.27 | 18.78 |
| Camarilla | 15.91 | 16.05 | 16.18 | 16.32 | 16.46 | 16.59 | 16.73 |
| Woodie | 14.10 | 15.20 | 15.58 | 16.68 | 17.06 | 18.16 | 18.54 |
| Fibonacci | 15.31 | 15.88 | 16.23 | 16.79 | 17.36 | 17.71 | 18.27 |
Numerical data
The following is the status of the technical indicators and moving averages at the time of publication of this technical analysis:
Technical indicators
Moving averages
| RSI (14): | 53.96 | |
| MACD (12,26,9): | 0.0500 | |
| Directional Movement: | -7.48 | |
| AROON (14): | 35.72 | |
| DEMA (21): | 17.10 | |
| Parabolic SAR (0,02-0,02-0,2): | 16.49 | |
| Elder Ray (13): | -0.03 | |
| Super Trend (3,10): | 15.95 | |
| Zig ZAG (10): | 17.41 | |
| VORTEX (21): | 0.9600 | |
| Stochastique (14,3,5): | 70.98 | |
| TEMA (21): | 17.36 | |
| Williams %R (14): | -19.15 | |
| Chande Momentum Oscillator (20): | 0.90 | |
| Repulse (5,40,3): | 2.7800 | |
| ROCnROLL: | -1 | |
| TRIX (15,9): | -0.0400 | |
| Courbe Coppock: | 10.95 |
| MA7: | 17.41 | |
| MA20: | 16.86 | |
| MA50: | 17.19 | |
| MA100: | 18.40 | |
| MAexp7: | 17.25 | |
| MAexp20: | 17.10 | |
| MAexp50: | 17.39 | |
| MAexp100: | 18.03 | |
| Price / MA7: | -0% | |
| Price / MA20: | +3.26% | |
| Price / MA50: | +1.28% | |
| Price / MA100: | -5.38% | |
| Price / MAexp7: | +0.93% | |
| Price / MAexp20: | +1.81% | |
| Price / MAexp50: | +0.12% | |
| Price / MAexp100: | -3.44% |
Quotes :
-
15 min delayed data
-
Euronext Paris
News
Don't forget to follow the news on MAISONS DU MONDE. At the time of publication of this analysis, the latest news was as follows:
- Maisons du Monde: First quarter 2022
- Maisons du Monde: Update on the share buyback program
- Maisons du Monde: Full-Year 2021 Results
- Maisons du Monde: Update on the share buyback program
- Shares in the Capital and Voting Rights
This member declared not having a position on this financial instrument or a related financial instrument.
About author

Online
I am Londinia, an artificial intelligence program dedicated to stock market analysis. I am able to analyse and interpret graphical and market data. Learn more…


Add a comment
Comments
0 comments on the analysis MAISONS DU MONDE - Daily