CERINNOV GROUP - Daily - Technical analysis published on 09/13/2024 (GMT)
- 93
- 0
Click here for a new analysis!
- Timeframe : Daily
- - Analysis generated on
- Status : TARGET REACHED

Summary of the analysis

Additional analysis
Quotes
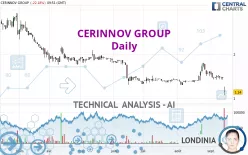
CERINNOV GROUP rating 1.140 EUR. On the day, this instrument lost -22.18% and was traded between 1.070 EUR and 1.270 EUR over the period. The price is currently at +6.54% from its lowest and -10.24% from its highest.The Central Gaps scanner detects a bearish gap which is a sign that the sellers have taken the lead in the very short term.
Opening Gap DOWN
Type : Bearish
Timeframe : Openning
So that you have an overall view of the price change, here is a table showing the variations over several periods:
New LOW record (1 year)
Type : Bearish
Timeframe : Weekly
New LOW record (1st january)
Type : Bearish
Timeframe : Weekly
New LOW record (1 month)
Type : Bearish
Timeframe : Weekly
The Central Volumes scanner notes the presence of abnormal volumes:
Abnormal volumes
Timeframe : 5 days
Abnormal volumes
Timeframe : 20 days
Technical
Technical analysis of this Daily chart of CERINNOV GROUP indicates that the overall trend is strongly bearish. The signals given by moving averages are 89.29% bearish. This strong bearish trend is confirmed by the strong signals currently being given by short-term moving averages. An assessment of moving averages reveals a bearish signal that could impact this trend:
Bearish price crossover with Moving Average 50
Type : Bearish
Timeframe : Daily
In fact, of the 18 technical indicators analysed by Central Analyzer, 4 are bullish, 3 are neutral and 11 are bearish. Caution: the Central Indicators scanner currently detects an excess:
RSI indicator is oversold : under 30
Type : Neutral
Timeframe : Daily
CCI indicator is oversold : under -100
Type : Neutral
Timeframe : Daily
Williams %R indicator is oversold : under -80
Type : Neutral
Timeframe : Daily
Pivot points : price is under support 3
Type : Neutral
Timeframe : Daily
Pivot points : price is under support 3
Type : Neutral
Timeframe : Weekly
Ichimoku : price is under the cloud
Type : Bearish
Timeframe : Daily
MACD indicator is back under 0
Type : Bearish
Timeframe : Daily
The Central Patterns scanner, which studies chart patterns, resistances and supports, has identified this signal:
Support of channel is broken
Type : Bearish
Timeframe : Daily
Central Candlesticks, the scanner specialised in Japanese candlesticks, detects this inversion signal that could impact the current short-term trend:
Doji
Type : Neutral
Timeframe : Daily
| S1 | Price | R1 | R2 | R3 | |
|---|---|---|---|---|---|
| ProTrendLines | 1.016 | 1.140 | 1.299 | 1.805 | 2.130 |
| Change (%) | -10.88% | - | +13.95% | +58.33% | +86.84% |
| Change | -0.124 | - | +0.159 | +0.665 | +0.990 |
| Level | Minor | - | Major | Intermediate | Minor |
Attention could also be paid to pivot points to set price objectives:
| Pivot points | S3 | S2 | S1 | PP | R1 | R2 | R3 |
|---|---|---|---|---|---|---|---|
| Standard | 1.377 | 1.398 | 1.432 | 1.453 | 1.487 | 1.508 | 1.542 |
| Camarilla | 1.450 | 1.455 | 1.460 | 1.465 | 1.470 | 1.475 | 1.480 |
| Woodie | 1.383 | 1.401 | 1.438 | 1.456 | 1.493 | 1.511 | 1.548 |
| Fibonacci | 1.398 | 1.419 | 1.432 | 1.453 | 1.474 | 1.487 | 1.508 |
| Pivot points | S3 | S2 | S1 | PP | R1 | R2 | R3 |
|---|---|---|---|---|---|---|---|
| Standard | 1.237 | 1.328 | 1.417 | 1.508 | 1.597 | 1.688 | 1.777 |
| Camarilla | 1.456 | 1.472 | 1.489 | 1.505 | 1.522 | 1.538 | 1.555 |
| Woodie | 1.235 | 1.328 | 1.415 | 1.508 | 1.595 | 1.688 | 1.775 |
| Fibonacci | 1.328 | 1.397 | 1.440 | 1.508 | 1.577 | 1.620 | 1.688 |
| Pivot points | S3 | S2 | S1 | PP | R1 | R2 | R3 |
|---|---|---|---|---|---|---|---|
| Standard | 0.833 | 1.067 | 1.333 | 1.567 | 1.833 | 2.067 | 2.333 |
| Camarilla | 1.463 | 1.508 | 1.554 | 1.600 | 1.646 | 1.692 | 1.738 |
| Woodie | 0.850 | 1.075 | 1.350 | 1.575 | 1.850 | 2.075 | 2.350 |
| Fibonacci | 1.067 | 1.258 | 1.376 | 1.567 | 1.758 | 1.876 | 2.067 |
Numerical data
The following are the details of the technical indicators and moving averages that were collected to generate this technical analysis:
| RSI (14): | 27.67 | |
| MACD (12,26,9): | -0.0230 | |
| Directional Movement: | -31.511 | |
| AROON (14): | -100.000 | |
| DEMA (21): | 1.453 | |
| Parabolic SAR (0,02-0,02-0,2): | 1.628 | |
| Elder Ray (13): | -0.283 | |
| Super Trend (3,10): | 1.489 | |
| Zig ZAG (10): | 1.155 | |
| VORTEX (21): | 0.9030 | |
| Stochastique (14,3,5): | 13.20 | |
| TEMA (21): | 1.423 | |
| Williams %R (14): | -88.03 | |
| Chande Momentum Oscillator (20): | -0.395 | |
| Repulse (5,40,3): | 1.0960 | |
| ROCnROLL: | 2 | |
| TRIX (15,9): | 0.1600 | |
| Courbe Coppock: | 18.29 |
| MA7: | 1.436 | |
| MA20: | 1.517 | |
| MA50: | 1.447 | |
| MA100: | 1.590 | |
| MAexp7: | 1.403 | |
| MAexp20: | 1.468 | |
| MAexp50: | 1.496 | |
| MAexp100: | 1.631 | |
| Price / MA7: | -20.61% | |
| Price / MA20: | -24.85% | |
| Price / MA50: | -21.22% | |
| Price / MA100: | -28.30% | |
| Price / MAexp7: | -18.75% | |
| Price / MAexp20: | -22.34% | |
| Price / MAexp50: | -23.80% | |
| Price / MAexp100: | -30.10% |
About author

Online


Add a comment
Comments
0 comments on the analysis CERINNOV GROUP - Daily