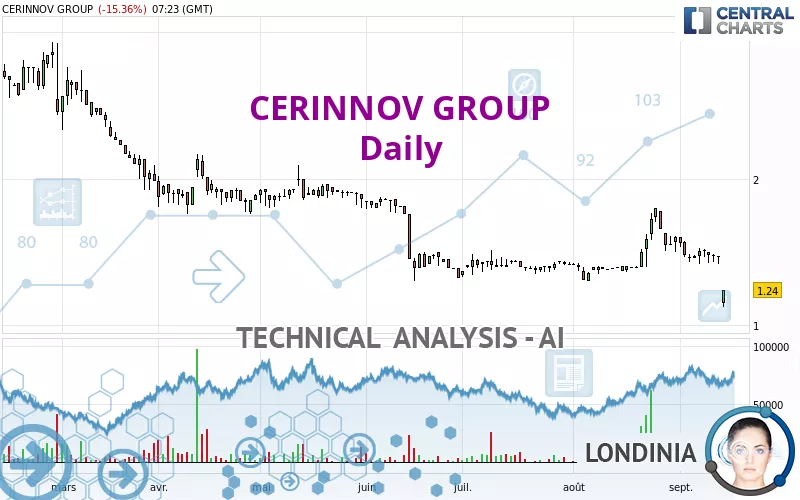
CERINNOV GROUP - Daily - Technical analysis published on 09/13/2024 (GMT)
- 105
- 0
Click here for a new analysis!
- Timeframe : Daily
- - Analysis generated on
- Status : TARGET REACHED

Summary of the analysis

Additional analysis
Quotes
The CERINNOV GROUP rating is 1.240 EUR. The price registered a decrease of -15.36% on the session and was between 1.125 EUR and 1.240 EUR. This implies that the price is at +10.22% from its lowest and at 0% from its highest.The Central Gaps scanner detects a bearish gap which is a sign that the sellers have taken the lead in the very short term.
Opening Gap DOWN
Type : Bearish
Timeframe : Openning
So that you have an overall view of the price change, here is a table showing the variations over several periods:
New LOW record (1 year)
Type : Bearish
Timeframe : Weekly
New LOW record (1st january)
Type : Bearish
Timeframe : Weekly
New LOW record (1 month)
Type : Bearish
Timeframe : Weekly
The Central Volumes scanner notes the presence of abnormal volumes:
Abnormal volumes
Timeframe : 20 days
Technical
A technical analysis in Daily of this CERINNOV GROUP chart shows a sharp bearish trend. The signals given by moving averages are 89.29% bearish. This strong bearish trend is confirmed by the strong signals currently being given by short-term moving averages. An assessment of moving averages reveals a bearish signal that could impact this trend:
Bearish price crossover with Moving Average 50
Type : Bearish
Timeframe : Daily
An assessment of technical indicators does not currently provide any relevant information to suggest whether the signal given by the technical indicators is more bullish or bearish.
Caution: the Central Indicators scanner currently detects an excess:
RSI indicator is oversold : under 30
Type : Neutral
Timeframe : Daily
CCI indicator is oversold : under -100
Type : Neutral
Timeframe : Daily
Williams %R indicator is oversold : under -80
Type : Neutral
Timeframe : Daily
Pivot points : price is under support 3
Type : Neutral
Timeframe : Daily
Pivot points : price is under support 3
Type : Neutral
Timeframe : Weekly
Ichimoku : price is under the cloud
Type : Bearish
Timeframe : Daily
MACD indicator is back under 0
Type : Bearish
Timeframe : Daily
Central Patterns, the scanner specializing in chart patterns, did not identify any signals.
From the Japanese candlestick perspective, the Central Candlesticks scanner notes the presence of these results that could impact the short-term trend:
Downside gap
Type : Bearish
Timeframe : Daily
Doji
Type : Neutral
Timeframe : Daily
| S1 | Price | R1 | R2 | R3 | |
|---|---|---|---|---|---|
| ProTrendLines | 1.016 | 1.240 | 1.299 | 1.805 | 2.130 |
| Change (%) | -18.06% | - | +4.76% | +45.56% | +71.77% |
| Change | -0.224 | - | +0.059 | +0.565 | +0.890 |
| Level | Minor | - | Major | Intermediate | Minor |
To determine price objectives, it is also possible to use the pivot points. Here is the price position in relation to pivot points:
| Pivot points | S3 | S2 | S1 | PP | R1 | R2 | R3 |
|---|---|---|---|---|---|---|---|
| Standard | 1.377 | 1.398 | 1.432 | 1.453 | 1.487 | 1.508 | 1.542 |
| Camarilla | 1.450 | 1.455 | 1.460 | 1.465 | 1.470 | 1.475 | 1.480 |
| Woodie | 1.383 | 1.401 | 1.438 | 1.456 | 1.493 | 1.511 | 1.548 |
| Fibonacci | 1.398 | 1.419 | 1.432 | 1.453 | 1.474 | 1.487 | 1.508 |
| Pivot points | S3 | S2 | S1 | PP | R1 | R2 | R3 |
|---|---|---|---|---|---|---|---|
| Standard | 1.237 | 1.328 | 1.417 | 1.508 | 1.597 | 1.688 | 1.777 |
| Camarilla | 1.456 | 1.472 | 1.489 | 1.505 | 1.522 | 1.538 | 1.555 |
| Woodie | 1.235 | 1.328 | 1.415 | 1.508 | 1.595 | 1.688 | 1.775 |
| Fibonacci | 1.328 | 1.397 | 1.440 | 1.508 | 1.577 | 1.620 | 1.688 |
| Pivot points | S3 | S2 | S1 | PP | R1 | R2 | R3 |
|---|---|---|---|---|---|---|---|
| Standard | 0.833 | 1.067 | 1.333 | 1.567 | 1.833 | 2.067 | 2.333 |
| Camarilla | 1.463 | 1.508 | 1.554 | 1.600 | 1.646 | 1.692 | 1.738 |
| Woodie | 0.850 | 1.075 | 1.350 | 1.575 | 1.850 | 2.075 | 2.350 |
| Fibonacci | 1.067 | 1.258 | 1.376 | 1.567 | 1.758 | 1.876 | 2.067 |
Numerical data
The following are the details of the technical indicators and moving averages that were collected to generate this technical analysis:
| RSI (14): | 28.41 | |
| MACD (12,26,9): | -0.0220 | |
| Directional Movement: | -28.576 | |
| AROON (14): | -100.000 | |
| DEMA (21): | 1.452 | |
| Parabolic SAR (0,02-0,02-0,2): | 1.628 | |
| Elder Ray (13): | -0.304 | |
| Super Trend (3,10): | 1.455 | |
| Zig ZAG (10): | 1.180 | |
| VORTEX (21): | 0.9600 | |
| Stochastique (14,3,5): | 13.03 | |
| TEMA (21): | 1.440 | |
| Williams %R (14): | -85.50 | |
| Chande Momentum Oscillator (20): | -0.330 | |
| Repulse (5,40,3): | 11.5550 | |
| ROCnROLL: | 2 | |
| TRIX (15,9): | 0.1690 | |
| Courbe Coppock: | 16.87 |
| MA7: | 1.448 | |
| MA20: | 1.519 | |
| MA50: | 1.448 | |
| MA100: | 1.590 | |
| MAexp7: | 1.423 | |
| MAexp20: | 1.470 | |
| MAexp50: | 1.497 | |
| MAexp100: | 1.631 | |
| Price / MA7: | -14.36% | |
| Price / MA20: | -18.37% | |
| Price / MA50: | -14.36% | |
| Price / MA100: | -22.01% | |
| Price / MAexp7: | -12.86% | |
| Price / MAexp20: | -15.65% | |
| Price / MAexp50: | -17.17% | |
| Price / MAexp100: | -23.97% |
About author

Online


Add a comment
Comments
0 comments on the analysis CERINNOV GROUP - Daily