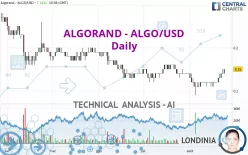
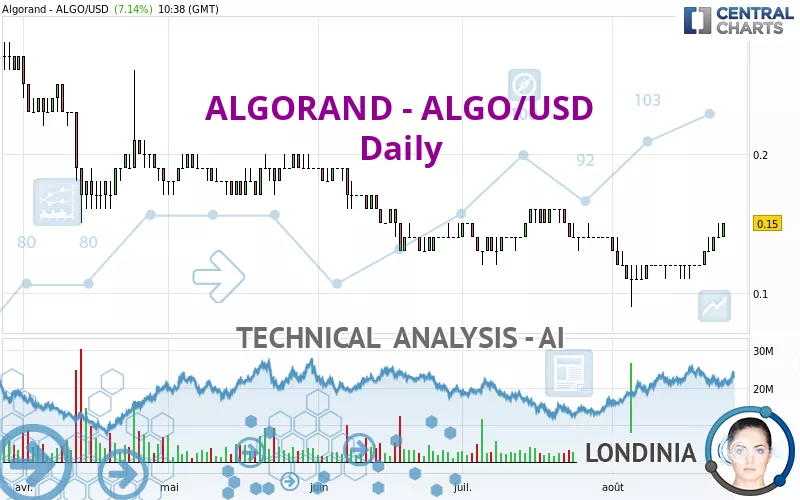
ALGORAND - ALGO/USD - Daily - Technical analysis published on 08/24/2024 (GMT)
- 321
- 0
Click here for a new analysis!
- Timeframe : Daily
- - Analysis generated on
- Status : INVALID
Summary of the analysis

Additional analysis
Quotes
ALGORAND - ALGO/USD rating 0.150000 USD. The price registered an increase of +7.14% on the session and was between 0.140000 USD and 0.150000 USD. This implies that the price is at +7.14% from its lowest and at 0% from its highest.Here is a more detailed summary of the historical variations registered by ALGORAND - ALGO/USD:
New HIGH record (1 month)
Type : Bullish
Timeframe : Weekly
Technical
A technical analysis in Daily of this ALGORAND - ALGO/USD chart shows a slightly bullish trend. 60.71% of the signals given by moving averages are bullish. The overall trend could accelerate as strong bullish signals from short-term moving averages are expected. The Central Indicators market scanner is currently detecting several bullish signals that could impact this trend:
Bullish price crossover with Moving Average 100
Type : Bullish
Timeframe : Daily
Bullish price crossover with adaptative moving average 50
Type : Bullish
Timeframe : Daily
Bullish price crossover with adaptative moving average 100
Type : Bullish
Timeframe : Daily
The probability of a further increase is high given the direction of the technical indicators.
Caution: the Central Indicators scanner currently detects an excess:
RSI indicator is overbought : over 70
Type : Neutral
Timeframe : Daily
CCI indicator is overbought : over 100
Type : Neutral
Timeframe : Daily
Williams %R indicator is overbought : over -20
Type : Neutral
Timeframe : Daily
Pivot points : price is over resistance 1
Type : Neutral
Timeframe : Daily
Pivot points : price is over resistance 3
Type : Neutral
Timeframe : Weekly
No signals are given by Central Patterns, a market scanner specialised in chart patterns, resistances and supports.
Central Candlesticks, the scanner specialised in Japanese candlesticks, detects this inversion signal that could impact the current short-term trend:
Doji
Type : Neutral
Timeframe : Daily
| S2 | S1 | Price | R1 | R2 | R3 | |
|---|---|---|---|---|---|---|
| ProTrendLines | 0.094000 | 0.130000 | 0.150000 | 0.170000 | 0.230000 | 0.280000 |
| Change (%) | -37.33% | -13.33% | - | +13.33% | +53.33% | +86.67% |
| Change | -0.056000 | -0.020000 | - | +0.020000 | +0.080000 | +0.130000 |
| Level | Intermediate | Intermediate | - | Major | Minor | Minor |
Attention could also be paid to pivot points to set price objectives:
| Pivot points | S3 | S2 | S1 | PP | R1 | R2 | R3 |
|---|---|---|---|---|---|---|---|
| Standard | 0.126667 | 0.133333 | 0.136667 | 0.143333 | 0.146667 | 0.153333 | 0.156667 |
| Camarilla | 0.137250 | 0.138167 | 0.139083 | 0.140000 | 0.140917 | 0.141833 | 0.142750 |
| Woodie | 0.125000 | 0.132500 | 0.135000 | 0.142500 | 0.145000 | 0.152500 | 0.155000 |
| Fibonacci | 0.133333 | 0.137153 | 0.139513 | 0.143333 | 0.147153 | 0.149513 | 0.153333 |
| Pivot points | S3 | S2 | S1 | PP | R1 | R2 | R3 |
|---|---|---|---|---|---|---|---|
| Standard | 0.103333 | 0.106667 | 0.113333 | 0.116667 | 0.123333 | 0.126667 | 0.133333 |
| Camarilla | 0.117250 | 0.118167 | 0.119083 | 0.120000 | 0.120917 | 0.121833 | 0.122750 |
| Woodie | 0.105000 | 0.107500 | 0.115000 | 0.117500 | 0.125000 | 0.127500 | 0.135000 |
| Fibonacci | 0.106667 | 0.110487 | 0.112847 | 0.116667 | 0.120487 | 0.122847 | 0.126667 |
| Pivot points | S3 | S2 | S1 | PP | R1 | R2 | R3 |
|---|---|---|---|---|---|---|---|
| Standard | 0.080000 | 0.100000 | 0.120000 | 0.140000 | 0.160000 | 0.180000 | 0.200000 |
| Camarilla | 0.129000 | 0.132667 | 0.136333 | 0.140000 | 0.143667 | 0.147333 | 0.151000 |
| Woodie | 0.080000 | 0.100000 | 0.120000 | 0.140000 | 0.160000 | 0.180000 | 0.200000 |
| Fibonacci | 0.100000 | 0.115280 | 0.124720 | 0.140000 | 0.155280 | 0.164720 | 0.180000 |
Numerical data
The following is the status of technical indicators and moving averages registered at the time this technical analysis was created:
| RSI (14): | 76.61 | |
| MACD (12,26,9): | 0.0020 | |
| Directional Movement: | 2.757573 | |
| AROON (14): | 78.571429 | |
| DEMA (21): | 0.129604 | |
| Parabolic SAR (0,02-0,02-0,2): | 0.097978 | |
| Elder Ray (13): | 0.014224 | |
| Super Trend (3,10): | 0.123285 | |
| Zig ZAG (10): | 0.150000 | |
| VORTEX (21): | 1.1250 | |
| Stochastique (14,3,5): | 91.67 | |
| TEMA (21): | 0.135822 | |
| Williams %R (14): | 0.00 | |
| Chande Momentum Oscillator (20): | 0.030000 | |
| Repulse (5,40,3): | 11.1843 | |
| ROCnROLL: | 1 | |
| TRIX (15,9): | -0.2829 | |
| Courbe Coppock: | 28.66 |
| MA7: | 0.132857 | |
| MA20: | 0.123000 | |
| MA50: | 0.134000 | |
| MA100: | 0.149000 | |
| MAexp7: | 0.135881 | |
| MAexp20: | 0.129136 | |
| MAexp50: | 0.134152 | |
| MAexp100: | 0.147678 | |
| Price / MA7: | +12.90% | |
| Price / MA20: | +21.95% | |
| Price / MA50: | +11.94% | |
| Price / MA100: | +0.67% | |
| Price / MAexp7: | +10.39% | |
| Price / MAexp20: | +16.16% | |
| Price / MAexp50: | +11.81% | |
| Price / MAexp100: | +1.57% |
About author

Online


Add a comment
Comments
0 comments on the analysis ALGORAND - ALGO/USD - Daily