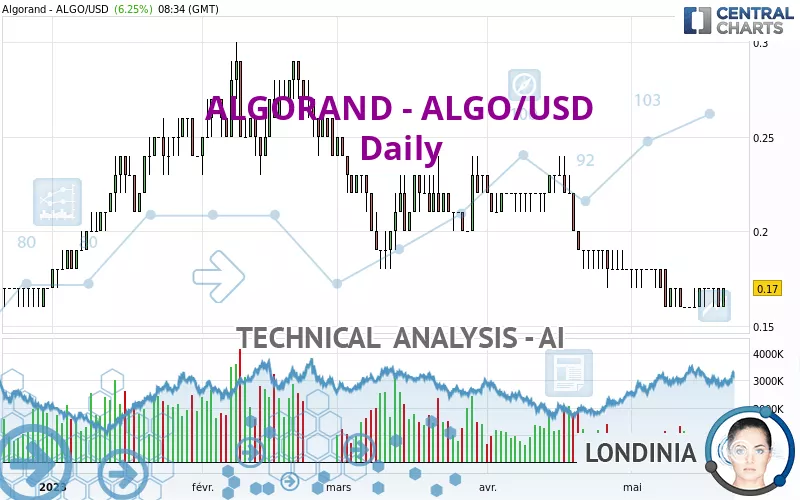
ALGORAND - ALGO/USD - Daily - Technical analysis published on 05/20/2023 (GMT)
- 308
- 0
Click here for a new analysis!
- Timeframe : Daily
- - Analysis generated on
- Status : TARGET REACHED
Summary of the analysis
Additional analysis
Quotes
The ALGORAND - ALGO/USD rating is 0.170000 USD. On the day, this instrument gained +6.25% and was traded between 0.160000 USD and 0.170000 USD over the period. The price is currently at +6.25% from its lowest and 0% from its highest.A study of price movements over other periods shows the following variations:
New LOW record (1 year)
Type : Bearish
Timeframe : Weekly
New LOW record (1st january)
Type : Bearish
Timeframe : Weekly
New LOW record (1 month)
Type : Bearish
Timeframe : Weekly
Technical
A technical analysis in Daily of this ALGORAND - ALGO/USD chart shows a sharp bearish trend. 85.71% of the signals given by moving averages are bearish. The slightly bearish signals from short-term moving averages show that the overall trend is slowing down. There is no crossing of moving average by the price or crossing of moving averages between themselves.
In fact, according to the parameters integrated into the Central Analyzer system, only 9 technical indicators out of 18 analysed are currently bullish. But beware of excesses. The Central Indicators scanner currently detects this:
RSI indicator: bullish divergence
Type : Bullish
Timeframe : Daily
Williams %R indicator is oversold : under -80
Type : Neutral
Timeframe : Daily
Price is back over the pivot point
Type : Bullish
Timeframe : Daily
Price is back over the pivot point
Type : Bullish
Timeframe : Weekly
Momentum indicator is back over 0
Type : Bullish
Timeframe : Daily
Central Patterns, the scanner specializing in chart patterns, did not identify any signals.
There is also a Japanese candlestick pattern detected by Central Candlesticks that could mark the end of the current short-term trend:
Doji
Type : Neutral
Timeframe : Daily
| S1 | Price | R1 | R2 | R3 | |
|---|---|---|---|---|---|
| ProTrendLines | 0.160000 | 0.170000 | 0.180000 | 0.240000 | 0.360000 |
| Change (%) | -5.88% | - | +5.88% | +41.18% | +111.76% |
| Change | -0.010000 | - | +0.010000 | +0.070000 | +0.190000 |
| Level | Intermediate | - | Intermediate | Major | Minor |
Pivot points can also be used to set your price objectives. Here is the price situation in relation to pivot points:
| Pivot points | S3 | S2 | S1 | PP | R1 | R2 | R3 |
|---|---|---|---|---|---|---|---|
| Standard | 0.146667 | 0.153333 | 0.156667 | 0.163333 | 0.166667 | 0.173333 | 0.176667 |
| Camarilla | 0.157250 | 0.158167 | 0.159083 | 0.160000 | 0.160917 | 0.161833 | 0.162750 |
| Woodie | 0.145000 | 0.152500 | 0.155000 | 0.162500 | 0.165000 | 0.172500 | 0.175000 |
| Fibonacci | 0.153333 | 0.157153 | 0.159513 | 0.163333 | 0.167153 | 0.169513 | 0.173333 |
| Pivot points | S3 | S2 | S1 | PP | R1 | R2 | R3 |
|---|---|---|---|---|---|---|---|
| Standard | 0.133333 | 0.146667 | 0.153333 | 0.166667 | 0.173333 | 0.186667 | 0.193333 |
| Camarilla | 0.154500 | 0.156333 | 0.158167 | 0.160000 | 0.161833 | 0.163667 | 0.165500 |
| Woodie | 0.130000 | 0.145000 | 0.150000 | 0.165000 | 0.170000 | 0.185000 | 0.190000 |
| Fibonacci | 0.146667 | 0.154307 | 0.159027 | 0.166667 | 0.174307 | 0.179027 | 0.186667 |
| Pivot points | S3 | S2 | S1 | PP | R1 | R2 | R3 |
|---|---|---|---|---|---|---|---|
| Standard | 0.083333 | 0.126667 | 0.153333 | 0.196667 | 0.223333 | 0.266667 | 0.293333 |
| Camarilla | 0.160750 | 0.167167 | 0.173583 | 0.180000 | 0.186417 | 0.192833 | 0.199250 |
| Woodie | 0.075000 | 0.122500 | 0.145000 | 0.192500 | 0.215000 | 0.262500 | 0.285000 |
| Fibonacci | 0.126667 | 0.153407 | 0.169927 | 0.196667 | 0.223407 | 0.239927 | 0.266667 |
Numerical data
The following is the status of technical indicators and moving averages registered at the time this technical analysis was created:
| RSI (14): | 32.01 | |
| MACD (12,26,9): | -0.0077 | |
| Directional Movement: | -15.238039 | |
| AROON (14): | -14.285714 | |
| DEMA (21): | 0.159625 | |
| Parabolic SAR (0,02-0,02-0,2): | 0.170000 | |
| Elder Ray (13): | -0.001909 | |
| Super Trend (3,10): | 0.183752 | |
| Zig ZAG (10): | 0.160000 | |
| VORTEX (21): | 0.8750 | |
| Stochastique (14,3,5): | 33.33 | |
| TEMA (21): | 0.162745 | |
| Williams %R (14): | -50.00 | |
| Chande Momentum Oscillator (20): | 0.010000 | |
| Repulse (5,40,3): | 5.2644 | |
| ROCnROLL: | -1 | |
| TRIX (15,9): | -0.6923 | |
| Courbe Coppock: | 11.31 |
| MA7: | 0.165714 | |
| MA20: | 0.170000 | |
| MA50: | 0.192200 | |
| MA100: | 0.212500 | |
| MAexp7: | 0.164519 | |
| MAexp20: | 0.171636 | |
| MAexp50: | 0.186515 | |
| MAexp100: | 0.204417 | |
| Price / MA7: | +2.59% | |
| Price / MA20: | -0% | |
| Price / MA50: | -11.55% | |
| Price / MA100: | -20.00% | |
| Price / MAexp7: | +3.33% | |
| Price / MAexp20: | -0.95% | |
| Price / MAexp50: | -8.85% | |
| Price / MAexp100: | -16.84% |
About author

Online


Add a comment
Comments
0 comments on the analysis ALGORAND - ALGO/USD - Daily