| Open: | 0.9522 |
| Change: | +0.0015 |
| Volume: | 33,423 |
| Low: | 0.9503 |
| High: | 0.9550 |
| High / Low range: | 0.0047 |
| Type: | Cryptocurrencies |
| Ticker: | ALGOUSD |
| ISIN: |
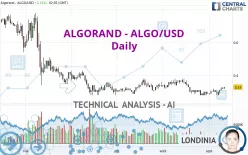
ALGORAND - ALGO/USD - Daily - Technical analysis published on 09/11/2022 (GMT)
- 264
- 0
- 09/11/2022 - 02:35
Click here for a new analysis!
- Timeframe : Daily
- - Analysis generated on 09/11/2022 - 02:35
- Status : TARGET REACHED

Summary of the analysis

Additional analysis
Quotes
The ALGORAND - ALGO/USD rating is 0.330000 USD. On the day, this instrument gained +3.13% and was between 0.320000 USD and 0.330000 USD. This implies that the price is at +3.13% from its lowest and at 0% from its highest.A study of price movements over other periods shows the following variations:
Technical
Technical analysis of this Daily chart of ALGORAND - ALGO/USD indicates that the overall trend is slightly bearish. 53.57% of the signals given by moving averages are bearish. Caution: the strong bullish signals currently being given by short-term moving averages could quickly lead to a reversal of the trend. An assessment of moving averages reveals several bullish signals that could impact this trend:
Bullish trend reversal : Moving Average 20
Type : Bullish
Timeframe : Daily
Bullish trend reversal : adaptative moving average 20
Type : Bullish
Timeframe : Daily
Bullish price crossover with adaptative moving average 20
Type : Bullish
Timeframe : Daily
The probability of a further increase is high given the direction of the technical indicators.
Caution: the Central Indicators scanner currently detects an excess:
CCI indicator is overbought : over 100
Type : Neutral
Timeframe : Daily
Williams %R indicator is overbought : over -20
Type : Neutral
Timeframe : Daily
Pivot points : price is over resistance 1
Type : Neutral
Timeframe : Weekly
Parabolic SAR indicator bullish reversal
Type : Bullish
Timeframe : Daily
Price is back over the pivot point
Type : Bullish
Timeframe : Daily
Central Patterns, the scanner specializing in chart patterns, did not identify any signals.
There is also a Japanese candlestick pattern detected by Central Candlesticks that could mark the end of the current short-term trend:
Doji
Type : Neutral
Timeframe : Daily
| S1 | Price | R1 | R2 | R3 | |
|---|---|---|---|---|---|
| ProTrendLines | 0.291111 | 0.330000 | 0.370588 | 0.570000 | 0.679857 |
| Change (%) | -11.78% | - | +12.30% | +72.73% | +106.02% |
| Change | -0.038889 | - | +0.040588 | +0.240000 | +0.349857 |
| Level | Major | - | Intermediate | Minor | Minor |
Attention could also be paid to pivot points to set price objectives:
| Pivot points | S3 | S2 | S1 | PP | R1 | R2 | R3 |
|---|---|---|---|---|---|---|---|
| Standard | 0.306667 | 0.313333 | 0.316667 | 0.323333 | 0.326667 | 0.333333 | 0.336667 |
| Camarilla | 0.317250 | 0.318167 | 0.319083 | 0.320000 | 0.320917 | 0.321833 | 0.322750 |
| Woodie | 0.305000 | 0.312500 | 0.315000 | 0.322500 | 0.325000 | 0.332500 | 0.335000 |
| Fibonacci | 0.313333 | 0.317153 | 0.319513 | 0.323333 | 0.327153 | 0.329513 | 0.333333 |
| Pivot points | S3 | S2 | S1 | PP | R1 | R2 | R3 |
|---|---|---|---|---|---|---|---|
| Standard | 0.240000 | 0.260000 | 0.290000 | 0.310000 | 0.340000 | 0.360000 | 0.390000 |
| Camarilla | 0.306250 | 0.310833 | 0.315417 | 0.320000 | 0.324583 | 0.329167 | 0.333750 |
| Woodie | 0.245000 | 0.262500 | 0.295000 | 0.312500 | 0.345000 | 0.362500 | 0.395000 |
| Fibonacci | 0.260000 | 0.279100 | 0.290900 | 0.310000 | 0.329100 | 0.340900 | 0.360000 |
| Pivot points | S3 | S2 | S1 | PP | R1 | R2 | R3 |
|---|---|---|---|---|---|---|---|
| Standard | 0.153333 | 0.216667 | 0.253333 | 0.316667 | 0.353333 | 0.416667 | 0.453333 |
| Camarilla | 0.262500 | 0.271667 | 0.280833 | 0.290000 | 0.299167 | 0.308333 | 0.317500 |
| Woodie | 0.140000 | 0.210000 | 0.240000 | 0.310000 | 0.340000 | 0.410000 | 0.440000 |
| Fibonacci | 0.216667 | 0.254867 | 0.278467 | 0.316667 | 0.354867 | 0.378467 | 0.416667 |
Numerical data
The following is the status of technical indicators and moving averages registered at the time this technical analysis was created:
| RSI (14): | 54.38 | |
| MACD (12,26,9): | -0.0021 | |
| Directional Movement: | 8.755423 | |
| AROON (14): | 85.714286 | |
| DEMA (21): | 0.303322 | |
| Parabolic SAR (0,02-0,02-0,2): | 0.281980 | |
| Elder Ray (13): | 0.016906 | |
| Super Trend (3,10): | 0.337200 | |
| Zig ZAG (10): | 0.320000 | |
| VORTEX (21): | 1.0588 | |
| Stochastique (14,3,5): | 80.00 | |
| TEMA (21): | 0.308061 | |
| Williams %R (14): | -20.00 | |
| Chande Momentum Oscillator (20): | 0.030000 | |
| Repulse (5,40,3): | 0.3171 | |
| ROCnROLL: | -1 | |
| TRIX (15,9): | -0.3517 | |
| Courbe Coppock: | 12.22 |
| MA7: | 0.308571 | |
| MA20: | 0.301000 | |
| MA50: | 0.324000 | |
| MA100: | 0.328600 | |
| MAexp7: | 0.314443 | |
| MAexp20: | 0.308600 | |
| MAexp50: | 0.320921 | |
| MAexp100: | 0.371768 | |
| Price / MA7: | +6.94% | |
| Price / MA20: | +9.63% | |
| Price / MA50: | +1.85% | |
| Price / MA100: | +0.43% | |
| Price / MAexp7: | +4.95% | |
| Price / MAexp20: | +6.93% | |
| Price / MAexp50: | +2.83% | |
| Price / MAexp100: | -11.23% |
About author
Online


Add a comment
Comments
0 comments on the analysis ALGORAND - ALGO/USD - Daily