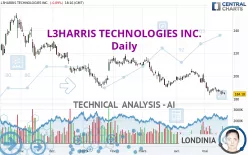
L3HARRIS TECHNOLOGIES INC. - Daily - Technical analysis published on 05/18/2023 (GMT)
- 194
- 0
Click here for a new analysis!
- Timeframe : Daily
- - Analysis generated on
- Status : INVALID

Summary of the analysis

Additional analysis
Quotes
L3HARRIS TECHNOLOGIES INC. rating 184.18 USD. The price is lower by -0.89% since the last closing with the lowest point at 183.66 USD and the highest point at 185.62 USD. The deviation from the price is +0.28% for the low point and -0.78% for the high point.The Central Gaps scanner detects a bearish opening. A small advantage for sellers in the very short term.
Bearish opening
Type : Bearish
Timeframe : Openning
So that you have an overall view of the price change, here is a table showing the variations over several periods:
Near a new LOW record (1 year)
Type : Bearish
Timeframe : Weekly
Near a new LOW record (1st january)
Type : Bearish
Timeframe : Weekly
Near a new LOW record (1 month)
Type : Bearish
Timeframe : Weekly
Technical
A technical analysis in Daily of this L3HARRIS TECHNOLOGIES INC. chart shows a sharp bearish trend. 92.86% of the signals given by moving averages are bearish. The overall trend is supported by the strong bearish signals from short-term moving averages. The Central Indicators market scanner currently does not detect any result that concerns moving averages.
On the 18 technical indicators analysed, 4 are bullish, 4 are neutral and 10 are bearish. Caution: the Central Indicators scanner currently detects an excess:
Williams %R indicator is oversold : under -80
Type : Neutral
Timeframe : Daily
Pivot points : price is under support 1
Type : Neutral
Timeframe : Weekly
Central Patterns, the scanner specializing in chart patterns, did not identify any signals.
No result was found by the Central Candlesticks scanner on Japanese candlesticks.
| S3 | S2 | S1 | Price | R1 | R2 | R3 | |
|---|---|---|---|---|---|---|---|
| ProTrendLines | 153.57 | 164.19 | 181.19 | 184.18 | 190.59 | 197.12 | 216.33 |
| Change (%) | -16.62% | -10.85% | -1.62% | - | +3.48% | +7.03% | +17.46% |
| Change | -30.61 | -19.99 | -2.99 | - | +6.41 | +12.94 | +32.15 |
| Level | Minor | Minor | Intermediate | - | Major | Major | Major |
To determine price objectives, it is also possible to use the pivot points. Here is the price position in relation to pivot points:
| Pivot points | S3 | S2 | S1 | PP | R1 | R2 | R3 |
|---|---|---|---|---|---|---|---|
| Standard | 180.86 | 182.43 | 184.13 | 185.70 | 187.40 | 188.97 | 190.67 |
| Camarilla | 184.93 | 185.23 | 185.53 | 185.83 | 186.13 | 186.43 | 186.73 |
| Woodie | 180.93 | 182.46 | 184.20 | 185.73 | 187.47 | 189.00 | 190.74 |
| Fibonacci | 182.43 | 183.68 | 184.45 | 185.70 | 186.95 | 187.72 | 188.97 |
| Pivot points | S3 | S2 | S1 | PP | R1 | R2 | R3 |
|---|---|---|---|---|---|---|---|
| Standard | 180.98 | 183.41 | 185.08 | 187.51 | 189.18 | 191.61 | 193.28 |
| Camarilla | 185.62 | 186.00 | 186.37 | 186.75 | 187.13 | 187.50 | 187.88 |
| Woodie | 180.60 | 183.22 | 184.70 | 187.32 | 188.80 | 191.42 | 192.90 |
| Fibonacci | 183.41 | 184.98 | 185.94 | 187.51 | 189.08 | 190.04 | 191.61 |
| Pivot points | S3 | S2 | S1 | PP | R1 | R2 | R3 |
|---|---|---|---|---|---|---|---|
| Standard | 178.16 | 186.05 | 190.60 | 198.49 | 203.04 | 210.93 | 215.48 |
| Camarilla | 191.73 | 192.87 | 194.01 | 195.15 | 196.29 | 197.43 | 198.57 |
| Woodie | 176.49 | 185.22 | 188.93 | 197.66 | 201.37 | 210.10 | 213.81 |
| Fibonacci | 186.05 | 190.80 | 193.74 | 198.49 | 203.24 | 206.18 | 210.93 |
Numerical data
The following is the status of technical indicators and moving averages registered at the time this technical analysis was created:
| RSI (14): | 32.90 | |
| MACD (12,26,9): | -3.6800 | |
| Directional Movement: | -14.24 | |
| AROON (14): | -28.57 | |
| DEMA (21): | 185.17 | |
| Parabolic SAR (0,02-0,02-0,2): | 187.29 | |
| Elder Ray (13): | -3.23 | |
| Super Trend (3,10): | 193.90 | |
| Zig ZAG (10): | 184.06 | |
| VORTEX (21): | 0.7200 | |
| Stochastique (14,3,5): | 7.81 | |
| TEMA (21): | 183.69 | |
| Williams %R (14): | -94.59 | |
| Chande Momentum Oscillator (20): | -5.57 | |
| Repulse (5,40,3): | -2.0200 | |
| ROCnROLL: | 2 | |
| TRIX (15,9): | -0.2400 | |
| Courbe Coppock: | 10.47 |
| MA7: | 186.24 | |
| MA20: | 190.74 | |
| MA50: | 195.43 | |
| MA100: | 200.70 | |
| MAexp7: | 186.05 | |
| MAexp20: | 189.81 | |
| MAexp50: | 195.27 | |
| MAexp100: | 201.39 | |
| Price / MA7: | -1.11% | |
| Price / MA20: | -3.44% | |
| Price / MA50: | -5.76% | |
| Price / MA100: | -8.23% | |
| Price / MAexp7: | -1.01% | |
| Price / MAexp20: | -2.97% | |
| Price / MAexp50: | -5.68% | |
| Price / MAexp100: | -8.55% |
About author

Online


Add a comment
Comments
0 comments on the analysis L3HARRIS TECHNOLOGIES INC. - Daily