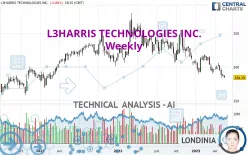
L3HARRIS TECHNOLOGIES INC. - Weekly - Technical analysis published on 05/18/2023 (GMT)
- 173
- 0
Click here for a new analysis!
- Timeframe : Weekly
- - Analysis generated on
- Status : LEVEL MAINTAINED

Summary of the analysis

Additional analysis
Quotes
L3HARRIS TECHNOLOGIES INC. rating 184.19 USD. The price is lower by -1.43% over the 5 days with the lowest point at 183.66 USD and the highest point at 187.95 USD. The deviation from the price is +0.29% for the low point and -2.00% for the high point.A bearish opening was detected by the Central Gaps scanner. Sellers are trying to impose a bearish trend in the very short term.
Bearish opening
Type : Bearish
Timeframe : Openning
So that you have an overall view of the price change, here is a table showing the variations over several periods:
Near a new LOW record (1 year)
Type : Bearish
Timeframe : Weekly
Near a new LOW record (1st january)
Type : Bearish
Timeframe : Weekly
Near a new LOW record (1 month)
Type : Bearish
Timeframe : Weekly
Technical
Technical analysis of this Weekly chart of L3HARRIS TECHNOLOGIES INC. indicates that the overall trend is strongly bearish. The signals given by moving averages are 92.86% bearish. This strong bearish trend is confirmed by the strong signals currently being given by short-term moving averages. There is no crossing of moving average by the price or crossing of moving averages between themselves.
In fact, 12 technical indicators on 18 studied are currently bearish. Caution: the Central Indicators scanner currently detects an excess:
CCI indicator is oversold : under -100
Type : Neutral
Timeframe : Weekly
Williams %R indicator is oversold : under -80
Type : Neutral
Timeframe : Weekly
Pivot points : price is under support 1
Type : Neutral
Timeframe : Weekly
An analysis of the price chart with the Central Patterns scanner (detector of chart patterns and resistances and supports) shows a result that can have an impact on the price change:
Support of channel is broken
Type : Bearish
Timeframe : Weekly
The Central Candlesticks scanner which studies Japanese candlesticks did not detect anything.
| S3 | S2 | S1 | Price | R1 | R2 | R3 | |
|---|---|---|---|---|---|---|---|
| ProTrendLines | 153.57 | 164.19 | 181.19 | 184.19 | 197.12 | 216.33 | 250.14 |
| Change (%) | -16.62% | -10.86% | -1.63% | - | +7.02% | +17.45% | +35.81% |
| Change | -30.62 | -20.00 | -3.00 | - | +12.93 | +32.14 | +65.95 |
| Level | Minor | Minor | Intermediate | - | Major | Major | Intermediate |
To determine price objectives, it is also possible to use the pivot points. Here is the price position in relation to pivot points:
| Pivot points | S3 | S2 | S1 | PP | R1 | R2 | R3 |
|---|---|---|---|---|---|---|---|
| Standard | 180.86 | 182.43 | 184.13 | 185.70 | 187.40 | 188.97 | 190.67 |
| Camarilla | 184.93 | 185.23 | 185.53 | 185.83 | 186.13 | 186.43 | 186.73 |
| Woodie | 180.93 | 182.46 | 184.20 | 185.73 | 187.47 | 189.00 | 190.74 |
| Fibonacci | 182.43 | 183.68 | 184.45 | 185.70 | 186.95 | 187.72 | 188.97 |
| Pivot points | S3 | S2 | S1 | PP | R1 | R2 | R3 |
|---|---|---|---|---|---|---|---|
| Standard | 180.98 | 183.41 | 185.08 | 187.51 | 189.18 | 191.61 | 193.28 |
| Camarilla | 185.62 | 186.00 | 186.37 | 186.75 | 187.13 | 187.50 | 187.88 |
| Woodie | 180.60 | 183.22 | 184.70 | 187.32 | 188.80 | 191.42 | 192.90 |
| Fibonacci | 183.41 | 184.98 | 185.94 | 187.51 | 189.08 | 190.04 | 191.61 |
| Pivot points | S3 | S2 | S1 | PP | R1 | R2 | R3 |
|---|---|---|---|---|---|---|---|
| Standard | 178.16 | 186.05 | 190.60 | 198.49 | 203.04 | 210.93 | 215.48 |
| Camarilla | 191.73 | 192.87 | 194.01 | 195.15 | 196.29 | 197.43 | 198.57 |
| Woodie | 176.49 | 185.22 | 188.93 | 197.66 | 201.37 | 210.10 | 213.81 |
| Fibonacci | 186.05 | 190.80 | 193.74 | 198.49 | 203.24 | 206.18 | 210.93 |
Numerical data
The following is the status of technical indicators and moving averages registered at the time this technical analysis was created:
| RSI (14): | 35.23 | |
| MACD (12,26,9): | -7.7500 | |
| Directional Movement: | -15.66 | |
| AROON (14): | -78.57 | |
| DEMA (21): | 190.19 | |
| Parabolic SAR (0,02-0,02-0,2): | 214.03 | |
| Elder Ray (13): | -10.14 | |
| Super Trend (3,10): | 211.07 | |
| Zig ZAG (10): | 184.06 | |
| VORTEX (21): | 0.9000 | |
| Stochastique (14,3,5): | 8.46 | |
| TEMA (21): | 187.26 | |
| Williams %R (14): | -97.79 | |
| Chande Momentum Oscillator (20): | -25.00 | |
| Repulse (5,40,3): | -6.8200 | |
| ROCnROLL: | 2 | |
| TRIX (15,9): | -0.4600 | |
| Courbe Coppock: | 14.68 |
| MA7: | 186.24 | |
| MA20: | 190.74 | |
| MA50: | 195.43 | |
| MA100: | 200.70 | |
| MAexp7: | 191.51 | |
| MAexp20: | 200.05 | |
| MAexp50: | 210.06 | |
| MAexp100: | 210.80 | |
| Price / MA7: | -1.10% | |
| Price / MA20: | -3.43% | |
| Price / MA50: | -5.75% | |
| Price / MA100: | -8.23% | |
| Price / MAexp7: | -3.82% | |
| Price / MAexp20: | -7.93% | |
| Price / MAexp50: | -12.32% | |
| Price / MAexp100: | -12.62% |
About author

Online


Add a comment
Comments
0 comments on the analysis L3HARRIS TECHNOLOGIES INC. - Weekly