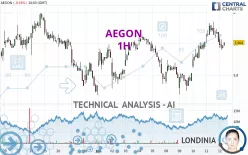
AEGON - 1H - Technical analysis published on 07/12/2024 (GMT)
- 152
- 0
Click here for a new analysis!
- Timeframe : 1H
- - Analysis generated on
- Status : INVALID

Summary of the analysis

Additional analysis
Quotes
AEGON rating 5.896 EUR. On the day, this instrument lost -0.17% with the lowest point at 5.880 EUR and the highest point at 5.924 EUR. The deviation from the price is +0.27% for the low point and -0.47% for the high point.So that you have an overall view of the price change, here is a table showing the variations over several periods:
Near a new HIGH record (5 years)
Type : Bullish
Timeframe : Weekly
Near a new HIGH record (1 month)
Type : Bullish
Timeframe : Weekly
Technical
A technical analysis in 1H of this AEGON chart shows a bullish trend. The signals given by moving averages are 67.86% bullish. This bullish trend could slow down given the neutral signals currently being given by short-term moving averages. The Central Indicators market scanner currently does not detect any result that concerns moving averages.
In fact, of the 18 technical indicators analysed by Central Analyzer, 3 are bullish, 9 are neutral and 6 are bearish. But beware of excesses. The Central Indicators scanner currently detects this:
Williams %R indicator is oversold : under -80
Type : Neutral
Timeframe : 1 hour
Pivot points : price is over resistance 1
Type : Neutral
Timeframe : Weekly
RSI indicator is back over 50
Type : Bullish
Timeframe : 1 hour
An analysis of the price chart with the Central Patterns scanner (detector of chart patterns and resistances and supports) shows a result that can have an impact on the price change:
Near support of channel
Type : Bullish
Timeframe : 1 hour
The Central Candlesticks scanner which studies Japanese candlesticks did not detect anything.
| S3 | S2 | S1 | Price | R1 | R2 | R3 | |
|---|---|---|---|---|---|---|---|
| ProTrendLines | 5.672 | 5.737 | 5.785 | 5.896 | 5.926 | 5.976 | 6.221 |
| Change (%) | -3.80% | -2.70% | -1.88% | - | +0.51% | +1.36% | +5.51% |
| Change | -0.224 | -0.159 | -0.111 | - | +0.030 | +0.080 | +0.325 |
| Level | Minor | Major | Major | - | Intermediate | Major | Major |
To determine price objectives, it is also possible to use the pivot points. Here is the price position in relation to pivot points:
| Pivot points | S3 | S2 | S1 | PP | R1 | R2 | R3 |
|---|---|---|---|---|---|---|---|
| Standard | 5.814 | 5.858 | 5.882 | 5.926 | 5.950 | 5.994 | 6.018 |
| Camarilla | 5.887 | 5.894 | 5.900 | 5.906 | 5.912 | 5.919 | 5.925 |
| Woodie | 5.804 | 5.853 | 5.872 | 5.921 | 5.940 | 5.989 | 6.008 |
| Fibonacci | 5.858 | 5.884 | 5.900 | 5.926 | 5.952 | 5.968 | 5.994 |
| Pivot points | S3 | S2 | S1 | PP | R1 | R2 | R3 |
|---|---|---|---|---|---|---|---|
| Standard | 5.555 | 5.657 | 5.723 | 5.825 | 5.891 | 5.993 | 6.059 |
| Camarilla | 5.744 | 5.759 | 5.775 | 5.790 | 5.805 | 5.821 | 5.836 |
| Woodie | 5.538 | 5.648 | 5.706 | 5.816 | 5.874 | 5.984 | 6.042 |
| Fibonacci | 5.657 | 5.721 | 5.761 | 5.825 | 5.889 | 5.929 | 5.993 |
| Pivot points | S3 | S2 | S1 | PP | R1 | R2 | R3 |
|---|---|---|---|---|---|---|---|
| Standard | 5.135 | 5.353 | 5.561 | 5.779 | 5.987 | 6.205 | 6.413 |
| Camarilla | 5.651 | 5.690 | 5.729 | 5.768 | 5.807 | 5.846 | 5.885 |
| Woodie | 5.129 | 5.351 | 5.555 | 5.777 | 5.981 | 6.203 | 6.407 |
| Fibonacci | 5.353 | 5.516 | 5.617 | 5.779 | 5.942 | 6.043 | 6.205 |
Numerical data
The following is the status of the technical indicators and moving averages at the time of publication of this technical analysis:
| RSI (14): | 50.90 | |
| MACD (12,26,9): | 0.0170 | |
| Directional Movement: | 4.605 | |
| AROON (14): | 57.143 | |
| DEMA (21): | 5.922 | |
| Parabolic SAR (0,02-0,02-0,2): | 5.960 | |
| Elder Ray (13): | -0.016 | |
| Super Trend (3,10): | 5.873 | |
| Zig ZAG (10): | 5.896 | |
| VORTEX (21): | 1.1450 | |
| Stochastique (14,3,5): | 14.82 | |
| TEMA (21): | 5.927 | |
| Williams %R (14): | -82.22 | |
| Chande Momentum Oscillator (20): | -0.012 | |
| Repulse (5,40,3): | -0.4720 | |
| ROCnROLL: | -1 | |
| TRIX (15,9): | 0.0610 | |
| Courbe Coppock: | 1.08 |
| MA7: | 5.853 | |
| MA20: | 5.857 | |
| MA50: | 5.885 | |
| MA100: | 5.646 | |
| MAexp7: | 5.906 | |
| MAexp20: | 5.897 | |
| MAexp50: | 5.873 | |
| MAexp100: | 5.860 | |
| Price / MA7: | +0.73% | |
| Price / MA20: | +0.67% | |
| Price / MA50: | +0.19% | |
| Price / MA100: | +4.43% | |
| Price / MAexp7: | -0.17% | |
| Price / MAexp20: | -0.02% | |
| Price / MAexp50: | +0.39% | |
| Price / MAexp100: | +0.61% |
News
The last news published on AEGON at the time of the generation of this analysis was as follows:
- Clearwater Successfully Implements PRISM for Aegon Asset Management to Help Support Business Growth
- Clearwater Successfully Implements PRISM for Aegon Asset Management to Help Support Business Growth
- Redomiciliation to Bermuda completed
- Extraordinary General Meeting approves first step in redomiciliation to Bermuda
- Aegon publishes agenda for Extraordinary General Meetings on September 29 and September 30, 2023
About author
Online


Add a comment
Comments
0 comments on the analysis AEGON - 1H