AEGON - Weekly - Technical analysis published on 12/09/2024 (GMT)
- 155
- 0
Click here for a new analysis!
- Timeframe : Weekly
- - Analysis generated on
- Status : INVALID

Summary of the analysis

Additional analysis
Quotes
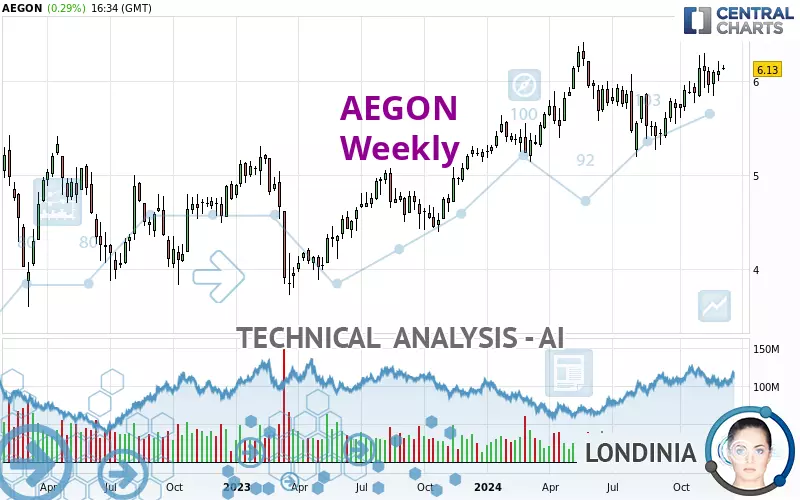
AEGON rating 6.130 EUR. The price is up +1.42% over 5 days and has been traded over the last 5 days between 6.086 EUR and 6.206 EUR. This implies that the 5 day price is +0.72% from its lowest point and -1.22% from its highest point.A bullish opening was detected by the Central Gaps scanner. Buyers are trying to impose a bullish momentum in the very short term.
Bullish opening
Type : Bullish
Timeframe : Openning
Here is a more detailed summary of the historical variations registered by AEGON:
Near a new HIGH record (5 years)
Type : Bullish
Timeframe : Weekly
Near a new HIGH record (1 year)
Type : Bullish
Timeframe : Weekly
Near a new HIGH record (1st january)
Type : Bullish
Timeframe : Weekly
Near a new LOW record (1 month)
Type : Bearish
Timeframe : Weekly
Technical
Technical analysis of this Weekly chart of AEGON indicates that the overall trend is strongly bullish. 92.86% of the signals given by moving averages are bullish. The overall trend is supported by the strong bullish signals from short-term moving averages. The Central Indicators market scanner is currently detecting a bearish signal that could impact this trend:
Moving Average bearish crossovers : AMA20 & AMA50
Type : Bearish
Timeframe : Weekly
In fact, 15 technical indicators on 18 studied are currently bullish. Caution: the Central Indicators scanner currently detects an excess:
CCI indicator is overbought : over 100
Type : Neutral
Timeframe : Weekly
CCI indicator: bearish divergence
Type : Bearish
Timeframe : Weekly
Williams %R indicator is overbought : over -20
Type : Neutral
Timeframe : Weekly
The Central Patterns scanner, which studies chart patterns, resistances and supports, has identified these signals:
Near resistance of channel
Type : Bearish
Timeframe : Weekly
Near horizontal support
Type : Bullish
Timeframe : Weekly
The Central Candlesticks scanner, specialised in Japanese candlesticks, did not identify any signals.
| S3 | S2 | S1 | Price | |
|---|---|---|---|---|
| ProTrendLines | 4.584 | 5.191 | 6.041 | 6.130 |
| Change (%) | -25.22% | -15.32% | -1.45% | - |
| Change | -1.546 | -0.939 | -0.089 | - |
| Level | Intermediate | Major | Major | - |
Attention could also be paid to pivot points to set price objectives:
| Pivot points | S3 | S2 | S1 | PP | R1 | R2 | R3 |
|---|---|---|---|---|---|---|---|
| Standard | 6.042 | 6.078 | 6.104 | 6.140 | 6.166 | 6.202 | 6.228 |
| Camarilla | 6.113 | 6.119 | 6.124 | 6.130 | 6.136 | 6.141 | 6.147 |
| Woodie | 6.037 | 6.076 | 6.099 | 6.138 | 6.161 | 6.200 | 6.223 |
| Fibonacci | 6.078 | 6.102 | 6.116 | 6.140 | 6.164 | 6.178 | 6.202 |
| Pivot points | S3 | S2 | S1 | PP | R1 | R2 | R3 |
|---|---|---|---|---|---|---|---|
| Standard | 5.783 | 5.891 | 6.001 | 6.109 | 6.219 | 6.327 | 6.437 |
| Camarilla | 6.052 | 6.072 | 6.092 | 6.112 | 6.132 | 6.152 | 6.172 |
| Woodie | 5.785 | 5.892 | 6.003 | 6.110 | 6.221 | 6.328 | 6.439 |
| Fibonacci | 5.891 | 5.974 | 6.025 | 6.109 | 6.192 | 6.243 | 6.327 |
| Pivot points | S3 | S2 | S1 | PP | R1 | R2 | R3 |
|---|---|---|---|---|---|---|---|
| Standard | 5.321 | 5.555 | 5.829 | 6.063 | 6.337 | 6.571 | 6.845 |
| Camarilla | 5.962 | 6.009 | 6.055 | 6.102 | 6.149 | 6.195 | 6.242 |
| Woodie | 5.340 | 5.565 | 5.848 | 6.073 | 6.356 | 6.581 | 6.864 |
| Fibonacci | 5.555 | 5.749 | 5.869 | 6.063 | 6.257 | 6.377 | 6.571 |
Numerical data
The following is the status of the technical indicators and moving averages at the time of publication of this technical analysis:
| RSI (14): | 63.25 | |
| MACD (12,26,9): | 0.1820 | |
| Directional Movement: | 13.415 | |
| AROON (14): | 71.429 | |
| DEMA (21): | 6.075 | |
| Parabolic SAR (0,02-0,02-0,2): | 5.767 | |
| Elder Ray (13): | 0.207 | |
| Super Trend (3,10): | 5.396 | |
| Zig ZAG (10): | 6.130 | |
| VORTEX (21): | 1.0950 | |
| Stochastique (14,3,5): | 82.04 | |
| TEMA (21): | 6.110 | |
| Williams %R (14): | -17.11 | |
| Chande Momentum Oscillator (20): | 0.520 | |
| Repulse (5,40,3): | 1.6660 | |
| ROCnROLL: | 1 | |
| TRIX (15,9): | 0.3800 | |
| Courbe Coppock: | 20.44 |
| MA7: | 6.121 | |
| MA20: | 6.033 | |
| MA50: | 5.924 | |
| MA100: | 5.716 | |
| MAexp7: | 6.042 | |
| MAexp20: | 5.844 | |
| MAexp50: | 5.507 | |
| MAexp100: | 5.045 | |
| Price / MA7: | +0.15% | |
| Price / MA20: | +1.61% | |
| Price / MA50: | +3.48% | |
| Price / MA100: | +7.24% | |
| Price / MAexp7: | +1.46% | |
| Price / MAexp20: | +4.89% | |
| Price / MAexp50: | +11.31% | |
| Price / MAexp100: | +21.51% |
News
Don't forget to follow the news on AEGON. At the time of publication of this analysis, the latest news was as follows:
- Clearwater Successfully Implements PRISM for Aegon Asset Management to Help Support Business Growth
- Clearwater Successfully Implements PRISM for Aegon Asset Management to Help Support Business Growth
- Redomiciliation to Bermuda completed
- Extraordinary General Meeting approves first step in redomiciliation to Bermuda
- Aegon publishes agenda for Extraordinary General Meetings on September 29 and September 30, 2023
About author

Online


Add a comment
Comments
0 comments on the analysis AEGON - Weekly