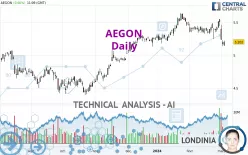
AEGON - Daily - Technical analysis published on 03/05/2024 (GMT)
- 136
- 0
Click here for a new analysis!
- Timeframe : Daily
- - Analysis generated on
- Status : INVALID

Summary of the analysis

Additional analysis
Quotes
The AEGON rating is 5.202 EUR. The price registered an increase of +0.66% on the session and was traded between 5.142 EUR and 5.220 EUR over the period. The price is currently at +1.17% from its lowest and -0.34% from its highest.So that you have an overall view of the price change, here is a table showing the variations over several periods:
Near a new LOW record (1st january)
Type : Bearish
Timeframe : Weekly
Near a new LOW record (1 month)
Type : Bearish
Timeframe : Weekly
Technical
Technical analysis of this Daily chart of AEGON indicates that the overall trend is not clearly defined. The strong bearish signals currently being given by short-term moving averages could allow the overall trend to return to a bearish trend. The Central Indicators scanner does not detect any result on moving averages that would impact this trend.
In fact, according to the parameters integrated into the Central Analyzer system, 14 technical indicators out of 18 analysed are currently bearish. But beware of excesses. The Central Indicators scanner currently detects this:
CCI indicator is oversold : under -100
Type : Neutral
Timeframe : Daily
Previous candle closed under Bollinger bands
Type : Neutral
Timeframe : Daily
Williams %R indicator is oversold : under -80
Type : Neutral
Timeframe : Daily
Price is back over the pivot point
Type : Bullish
Timeframe : Daily
Central Patterns, the market scanner focusing on chart patterns, resistances and supports found these results:
Near horizontal support
Type : Bullish
Timeframe : Daily
Support of channel is broken
Type : Bearish
Timeframe : Daily
The presence of a bullish Japanese candlestick pattern detected by Central Candlesticks that could cause a very short term rebound was also detected:
Bullish engulfing lines
Type : Bullish
Timeframe : Daily
| S3 | S2 | S1 | Price | R1 | R2 | R3 | |
|---|---|---|---|---|---|---|---|
| ProTrendLines | 4.435 | 4.652 | 4.956 | 5.202 | 5.219 | 5.371 | 5.628 |
| Change (%) | -14.74% | -10.57% | -4.73% | - | +0.33% | +3.25% | +8.19% |
| Change | -0.767 | -0.550 | -0.246 | - | +0.017 | +0.169 | +0.426 |
| Level | Intermediate | Intermediate | Major | - | Intermediate | Major | Major |
To determine price objectives, it is also possible to use the pivot points. Here is the price position in relation to pivot points:
| Pivot points | S3 | S2 | S1 | PP | R1 | R2 | R3 |
|---|---|---|---|---|---|---|---|
| Standard | 5.035 | 5.085 | 5.127 | 5.177 | 5.219 | 5.269 | 5.311 |
| Camarilla | 5.143 | 5.151 | 5.160 | 5.168 | 5.176 | 5.185 | 5.193 |
| Woodie | 5.030 | 5.083 | 5.122 | 5.175 | 5.214 | 5.267 | 5.306 |
| Fibonacci | 5.085 | 5.121 | 5.142 | 5.177 | 5.213 | 5.234 | 5.269 |
| Pivot points | S3 | S2 | S1 | PP | R1 | R2 | R3 |
|---|---|---|---|---|---|---|---|
| Standard | 4.809 | 5.019 | 5.129 | 5.339 | 5.449 | 5.659 | 5.769 |
| Camarilla | 5.150 | 5.179 | 5.209 | 5.238 | 5.267 | 5.297 | 5.326 |
| Woodie | 4.758 | 4.994 | 5.078 | 5.314 | 5.398 | 5.634 | 5.718 |
| Fibonacci | 5.019 | 5.142 | 5.217 | 5.339 | 5.462 | 5.537 | 5.659 |
| Pivot points | S3 | S2 | S1 | PP | R1 | R2 | R3 |
|---|---|---|---|---|---|---|---|
| Standard | 5.041 | 5.143 | 5.345 | 5.447 | 5.649 | 5.751 | 5.953 |
| Camarilla | 5.462 | 5.490 | 5.518 | 5.546 | 5.574 | 5.602 | 5.630 |
| Woodie | 5.090 | 5.168 | 5.394 | 5.472 | 5.698 | 5.776 | 6.002 |
| Fibonacci | 5.143 | 5.260 | 5.331 | 5.447 | 5.564 | 5.635 | 5.751 |
Numerical data
The following are the details of the technical indicators and moving averages that were collected to generate this technical analysis:
| RSI (14): | 38.44 | |
| MACD (12,26,9): | -0.0240 | |
| Directional Movement: | -18.807 | |
| AROON (14): | -14.286 | |
| DEMA (21): | 5.348 | |
| Parabolic SAR (0,02-0,02-0,2): | 5.533 | |
| Elder Ray (13): | -0.169 | |
| Super Trend (3,10): | 5.488 | |
| Zig ZAG (10): | 5.210 | |
| VORTEX (21): | 0.8250 | |
| Stochastique (14,3,5): | 9.21 | |
| TEMA (21): | 5.295 | |
| Williams %R (14): | -82.61 | |
| Chande Momentum Oscillator (20): | -0.166 | |
| Repulse (5,40,3): | -0.0450 | |
| ROCnROLL: | 2 | |
| TRIX (15,9): | 0.0000 | |
| Courbe Coppock: | 1.99 |
| MA7: | 5.354 | |
| MA20: | 5.380 | |
| MA50: | 5.375 | |
| MA100: | 5.126 | |
| MAexp7: | 5.311 | |
| MAexp20: | 5.367 | |
| MAexp50: | 5.326 | |
| MAexp100: | 5.162 | |
| Price / MA7: | -2.84% | |
| Price / MA20: | -3.31% | |
| Price / MA50: | -3.22% | |
| Price / MA100: | +1.48% | |
| Price / MAexp7: | -2.05% | |
| Price / MAexp20: | -3.07% | |
| Price / MAexp50: | -2.33% | |
| Price / MAexp100: | +0.77% |
News
Don't forget to follow the news on AEGON. At the time of publication of this analysis, the latest news was as follows:
- Redomiciliation to Bermuda completed
- Extraordinary General Meeting approves first step in redomiciliation to Bermuda
- Aegon publishes agenda for Extraordinary General Meetings on September 29 and September 30, 2023
- Aegon reports first half year 2023 results
- Aegon announces determination of the coupon rate for Perpetual Capital Securities
About author
Online


Add a comment
Comments
0 comments on the analysis AEGON - Daily