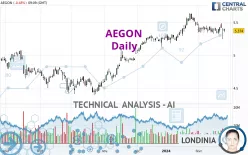
AEGON - Daily - Technical analysis published on 02/26/2024 (GMT)
- 143
- 0
Click here for a new analysis!
- Timeframe : Daily
- - Analysis generated on
- Status : LEVEL MAINTAINED

Summary of the analysis

Additional analysis
Quotes
The AEGON rating is 5.374 EUR. The price registered a decrease of -0.48% on the session and was between 5.348 EUR and 5.400 EUR. This implies that the price is at +0.49% from its lowest and at -0.48% from its highest.Here is a more detailed summary of the historical variations registered by AEGON:
Near a new HIGH record (5 years)
Type : Bullish
Timeframe : Weekly
Near a new HIGH record (1 year)
Type : Bullish
Timeframe : Weekly
Near a new HIGH record (1st january)
Type : Bullish
Timeframe : Weekly
Near a new HIGH record (1 month)
Type : Bullish
Timeframe : Weekly
Technical
Technical analysis of this Daily chart of AEGON indicates that the overall trend is bullish. The signals given by moving averages are 71.43% bullish. This bullish trend could slow down given the neutral signals currently being given by short-term moving averages. The Central Indicators market scanner currently does not detect any result that concerns moving averages.
The technical indicators are generally neutral. They do not provide relevant information on the direction of future price movements.
Central Indicators, the scanner specialised in technical indicators, has identified these signals:
RSI indicator is back under 50
Type : Bearish
Timeframe : Daily
Price is back under the pivot point
Type : Bearish
Timeframe : Weekly
Momentum indicator is back under 0
Type : Bearish
Timeframe : Daily
Central Patterns, the scanner specializing in chart patterns, did not identify any signals.
No result was found by the Central Candlesticks scanner on Japanese candlesticks.
| S3 | S2 | S1 | Price | R1 | |
|---|---|---|---|---|---|
| ProTrendLines | 4.652 | 4.956 | 5.359 | 5.374 | 5.628 |
| Change (%) | -13.44% | -7.78% | -0.28% | - | +4.73% |
| Change | -0.722 | -0.418 | -0.015 | - | +0.254 |
| Level | Minor | Major | Major | - | Intermediate |
To determine price objectives, it is also possible to use the pivot points. Here is the price position in relation to pivot points:
| Pivot points | S3 | S2 | S1 | PP | R1 | R2 | R3 |
|---|---|---|---|---|---|---|---|
| Standard | 5.130 | 5.188 | 5.294 | 5.352 | 5.458 | 5.516 | 5.622 |
| Camarilla | 5.355 | 5.370 | 5.385 | 5.400 | 5.415 | 5.430 | 5.445 |
| Woodie | 5.154 | 5.200 | 5.318 | 5.364 | 5.482 | 5.528 | 5.646 |
| Fibonacci | 5.188 | 5.251 | 5.289 | 5.352 | 5.415 | 5.453 | 5.516 |
| Pivot points | S3 | S2 | S1 | PP | R1 | R2 | R3 |
|---|---|---|---|---|---|---|---|
| Standard | 5.026 | 5.136 | 5.268 | 5.378 | 5.510 | 5.620 | 5.752 |
| Camarilla | 5.334 | 5.356 | 5.378 | 5.400 | 5.422 | 5.444 | 5.467 |
| Woodie | 5.037 | 5.142 | 5.279 | 5.384 | 5.521 | 5.626 | 5.763 |
| Fibonacci | 5.136 | 5.228 | 5.286 | 5.378 | 5.470 | 5.528 | 5.620 |
| Pivot points | S3 | S2 | S1 | PP | R1 | R2 | R3 |
|---|---|---|---|---|---|---|---|
| Standard | 4.756 | 4.968 | 5.216 | 5.428 | 5.676 | 5.888 | 6.136 |
| Camarilla | 5.338 | 5.380 | 5.422 | 5.464 | 5.506 | 5.548 | 5.591 |
| Woodie | 4.774 | 4.977 | 5.234 | 5.437 | 5.694 | 5.897 | 6.154 |
| Fibonacci | 4.968 | 5.144 | 5.252 | 5.428 | 5.604 | 5.712 | 5.888 |
Numerical data
The following is the status of the technical indicators and moving averages at the time of publication of this technical analysis:
| RSI (14): | 49.26 | |
| MACD (12,26,9): | 0.0070 | |
| Directional Movement: | -13.623 | |
| AROON (14): | -7.143 | |
| DEMA (21): | 5.414 | |
| Parabolic SAR (0,02-0,02-0,2): | 5.488 | |
| Elder Ray (13): | -0.025 | |
| Super Trend (3,10): | 5.348 | |
| Zig ZAG (10): | 5.386 | |
| VORTEX (21): | 0.8810 | |
| Stochastique (14,3,5): | 59.27 | |
| TEMA (21): | 5.378 | |
| Williams %R (14): | -43.80 | |
| Chande Momentum Oscillator (20): | -0.018 | |
| Repulse (5,40,3): | 1.1500 | |
| ROCnROLL: | -1 | |
| TRIX (15,9): | 0.0300 | |
| Courbe Coppock: | 0.95 |
| MA7: | 5.391 | |
| MA20: | 5.401 | |
| MA50: | 5.364 | |
| MA100: | 5.081 | |
| MAexp7: | 5.393 | |
| MAexp20: | 5.398 | |
| MAexp50: | 5.322 | |
| MAexp100: | 5.141 | |
| Price / MA7: | -0.32% | |
| Price / MA20: | -0.50% | |
| Price / MA50: | +0.19% | |
| Price / MA100: | +5.77% | |
| Price / MAexp7: | -0.35% | |
| Price / MAexp20: | -0.44% | |
| Price / MAexp50: | +0.98% | |
| Price / MAexp100: | +4.53% |
News
The last news published on AEGON at the time of the generation of this analysis was as follows:
- Redomiciliation to Bermuda completed
- Extraordinary General Meeting approves first step in redomiciliation to Bermuda
- Aegon publishes agenda for Extraordinary General Meetings on September 29 and September 30, 2023
- Aegon reports first half year 2023 results
- Aegon announces determination of the coupon rate for Perpetual Capital Securities
About author
Online


Add a comment
Comments
0 comments on the analysis AEGON - Daily