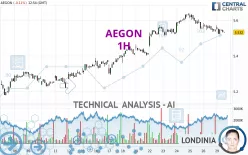
AEGON - 1H - Technical analysis published on 01/29/2024 (GMT)
- 148
- 0
Click here for a new analysis!
- Timeframe : 1H
- - Analysis generated on
- Status : LEVEL MAINTAINED

Summary of the analysis

Additional analysis
Quotes
The AEGON price is 5.532 EUR. The price is lower by -0.11% since the last closing and was between 5.524 EUR and 5.570 EUR. This implies that the price is at +0.14% from its lowest and at -0.68% from its highest.A bullish opening was detected by the Central Gaps scanner. Buyers are trying to impose a bullish momentum in the very short term.
Bullish opening
Type : Bullish
Timeframe : Openning
Here is a more detailed summary of the historical variations registered by AEGON:
Near a new HIGH record (5 years)
Type : Bullish
Timeframe : Weekly
Near a new HIGH record (1 year)
Type : Bullish
Timeframe : Weekly
Near a new HIGH record (1st january)
Type : Bullish
Timeframe : Weekly
Near a new HIGH record (1 month)
Type : Bullish
Timeframe : Weekly
Technical
Technical analysis of this 1H chart of AEGON indicates that the overall trend is slightly bullish. 60.71% of the signals given by moving averages are bullish. Caution: the strong bearish signals currently being given by short-term moving averages indicate that this slightly bullish trend could be reversed. An assessment of moving averages reveals a bearish signal that could impact this trend:
Moving Average bearish crossovers : MA20 & MA50
Type : Bearish
Timeframe : 1 hour
In fact, only 8 technical indicators out of 18 studied are currently bearish. Central Indicators, the scanner specialised in technical indicators, has identified this signal:
Price is back under the pivot point
Type : Bearish
Timeframe : Weekly
No signals are given by Central Patterns, a market scanner specialised in chart patterns, resistances and supports.
The Central Candlesticks scanner, specialised in Japanese candlesticks, did not identify any signals.
| S3 | S2 | S1 | Price | R1 | R2 | |
|---|---|---|---|---|---|---|
| ProTrendLines | 5.329 | 5.403 | 5.514 | 5.532 | 5.572 | 5.640 |
| Change (%) | -3.67% | -2.33% | -0.33% | - | +0.72% | +1.95% |
| Change | -0.203 | -0.129 | -0.018 | - | +0.040 | +0.108 |
| Level | Major | Minor | Minor | - | Minor | Intermediate |
To determine price objectives, it is also possible to use the pivot points. Here is the price position in relation to pivot points:
| Pivot points | S3 | S2 | S1 | PP | R1 | R2 | R3 |
|---|---|---|---|---|---|---|---|
| Standard | 5.470 | 5.502 | 5.520 | 5.552 | 5.570 | 5.602 | 5.620 |
| Camarilla | 5.524 | 5.529 | 5.533 | 5.538 | 5.543 | 5.547 | 5.552 |
| Woodie | 5.463 | 5.499 | 5.513 | 5.549 | 5.563 | 5.599 | 5.613 |
| Fibonacci | 5.502 | 5.521 | 5.533 | 5.552 | 5.571 | 5.583 | 5.602 |
| Pivot points | S3 | S2 | S1 | PP | R1 | R2 | R3 |
|---|---|---|---|---|---|---|---|
| Standard | 5.255 | 5.353 | 5.445 | 5.543 | 5.635 | 5.733 | 5.825 |
| Camarilla | 5.486 | 5.503 | 5.521 | 5.538 | 5.555 | 5.573 | 5.590 |
| Woodie | 5.253 | 5.352 | 5.443 | 5.542 | 5.633 | 5.732 | 5.823 |
| Fibonacci | 5.353 | 5.425 | 5.470 | 5.543 | 5.615 | 5.660 | 5.733 |
| Pivot points | S3 | S2 | S1 | PP | R1 | R2 | R3 |
|---|---|---|---|---|---|---|---|
| Standard | 4.814 | 4.924 | 5.086 | 5.196 | 5.358 | 5.468 | 5.630 |
| Camarilla | 5.173 | 5.198 | 5.223 | 5.248 | 5.273 | 5.298 | 5.323 |
| Woodie | 4.840 | 4.937 | 5.112 | 5.209 | 5.384 | 5.481 | 5.656 |
| Fibonacci | 4.924 | 5.028 | 5.092 | 5.196 | 5.300 | 5.364 | 5.468 |
Numerical data
The following is the status of technical indicators and moving averages registered at the time this technical analysis was created:
| RSI (14): | 44.68 | |
| MACD (12,26,9): | -0.0070 | |
| Directional Movement: | -6.068 | |
| AROON (14): | -71.428 | |
| DEMA (21): | 5.549 | |
| Parabolic SAR (0,02-0,02-0,2): | 5.568 | |
| Elder Ray (13): | -0.007 | |
| Super Trend (3,10): | 5.602 | |
| Zig ZAG (10): | 5.540 | |
| VORTEX (21): | 0.8200 | |
| Stochastique (14,3,5): | 32.12 | |
| TEMA (21): | 5.530 | |
| Williams %R (14): | -73.33 | |
| Chande Momentum Oscillator (20): | -0.030 | |
| Repulse (5,40,3): | -0.2320 | |
| ROCnROLL: | -1 | |
| TRIX (15,9): | -0.0110 | |
| Courbe Coppock: | 1.23 |
| MA7: | 5.535 | |
| MA20: | 5.385 | |
| MA50: | 5.228 | |
| MA100: | 4.931 | |
| MAexp7: | 5.543 | |
| MAexp20: | 5.555 | |
| MAexp50: | 5.538 | |
| MAexp100: | 5.481 | |
| Price / MA7: | -0.05% | |
| Price / MA20: | +2.73% | |
| Price / MA50: | +5.81% | |
| Price / MA100: | +12.19% | |
| Price / MAexp7: | -0.20% | |
| Price / MAexp20: | -0.41% | |
| Price / MAexp50: | -0.11% | |
| Price / MAexp100: | +0.93% |
News
The latest news and videos published on AEGON at the time of the analysis were as follows:
- Redomiciliation to Bermuda completed
- Extraordinary General Meeting approves first step in redomiciliation to Bermuda
- Aegon publishes agenda for Extraordinary General Meetings on September 29 and September 30, 2023
- Aegon reports first half year 2023 results
- Aegon announces determination of the coupon rate for Perpetual Capital Securities
About author
Online


Add a comment
Comments
0 comments on the analysis AEGON - 1H