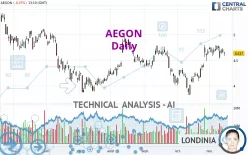
AEGON - Daily - Technical analysis published on 11/15/2022 (GMT)
- 146
- 0
Click here for a new analysis!
- Timeframe : Daily
- - Analysis generated on
- Status : LEVEL MAINTAINED

Summary of the analysis

Additional analysis
Quotes
The AEGON rating is 4.637 EUR. On the day, this instrument lost -0.37% and was traded between 4.585 EUR and 4.669 EUR over the period. The price is currently at +1.13% from its lowest and -0.69% from its highest.A bearish gap was detected at the opening by the Central Gaps scanner. There are a lot of sellers and they have the upper hand in the very short term.
Opening Gap DOWN
Type : Bearish
Timeframe : Openning
A study of price movements over other periods shows the following variations:
Near a new HIGH record (1 month)
Type : Bullish
Timeframe : Weekly
Technical
Technical analysis of this Daily chart of AEGON indicates that the overall trend is strongly bullish. The signals given by the moving averages are 92.86% bullish. This strong bullish trend is confirmed by the strong signals currently being given by short-term moving averages. The Central Indicators market scanner currently does not detect any result that concerns moving averages.
In fact, of the 18 technical indicators analysed by Central Analyzer, 5 are bullish, 7 are neutral and 6 are bearish. Central Indicators, the scanner specialised in technical indicators, has identified these signals:
MACD crosses DOWN its Moving Average
Type : Bearish
Timeframe : Daily
Price is back under the pivot point
Type : Bearish
Timeframe : Weekly
Williams %R indicator is back under -50
Type : Bearish
Timeframe : Daily
Central Patterns, the market scanner focusing on chart patterns, resistances and supports found this result:
Near support of channel
Type : Bullish
Timeframe : Daily
No result was found by the Central Candlesticks scanner on Japanese candlesticks.
| S3 | S2 | S1 | Price | R1 | R2 | R3 | |
|---|---|---|---|---|---|---|---|
| ProTrendLines | 3.891 | 4.064 | 4.498 | 4.637 | 4.773 | 5.142 | 5.873 |
| Change (%) | -16.09% | -12.36% | -3.00% | - | +2.93% | +10.89% | +26.66% |
| Change | -0.746 | -0.573 | -0.139 | - | +0.136 | +0.505 | +1.236 |
| Level | Intermediate | Intermediate | Major | - | Major | Major | Minor |
To determine price objectives, it is also possible to use the pivot points. Here is the price position in relation to pivot points:
| Pivot points | S3 | S2 | S1 | PP | R1 | R2 | R3 |
|---|---|---|---|---|---|---|---|
| Standard | 4.539 | 4.597 | 4.625 | 4.683 | 4.711 | 4.769 | 4.797 |
| Camarilla | 4.630 | 4.638 | 4.646 | 4.654 | 4.662 | 4.670 | 4.678 |
| Woodie | 4.525 | 4.590 | 4.611 | 4.676 | 4.697 | 4.762 | 4.783 |
| Fibonacci | 4.597 | 4.630 | 4.650 | 4.683 | 4.716 | 4.736 | 4.769 |
| Pivot points | S3 | S2 | S1 | PP | R1 | R2 | R3 |
|---|---|---|---|---|---|---|---|
| Standard | 4.263 | 4.397 | 4.523 | 4.657 | 4.783 | 4.917 | 5.043 |
| Camarilla | 4.578 | 4.601 | 4.625 | 4.649 | 4.673 | 4.697 | 4.721 |
| Woodie | 4.259 | 4.395 | 4.519 | 4.655 | 4.779 | 4.915 | 5.039 |
| Fibonacci | 4.397 | 4.496 | 4.558 | 4.657 | 4.756 | 4.818 | 4.917 |
| Pivot points | S3 | S2 | S1 | PP | R1 | R2 | R3 |
|---|---|---|---|---|---|---|---|
| Standard | 3.093 | 3.458 | 4.071 | 4.436 | 5.049 | 5.414 | 6.027 |
| Camarilla | 4.416 | 4.506 | 4.595 | 4.685 | 4.775 | 4.864 | 4.954 |
| Woodie | 3.218 | 3.520 | 4.196 | 4.498 | 5.174 | 5.476 | 6.152 |
| Fibonacci | 3.458 | 3.831 | 4.062 | 4.436 | 4.809 | 5.040 | 5.414 |
Numerical data
The following are the details of the technical indicators and moving averages that were collected to generate this technical analysis:
| RSI (14): | 57.01 | |
| MACD (12,26,9): | 0.0970 | |
| Directional Movement: | -0.984 | |
| AROON (14): | 7.143 | |
| DEMA (21): | 4.699 | |
| Parabolic SAR (0,02-0,02-0,2): | 4.784 | |
| Elder Ray (13): | -0.002 | |
| Super Trend (3,10): | 4.353 | |
| Zig ZAG (10): | 4.632 | |
| VORTEX (21): | 1.0840 | |
| Stochastique (14,3,5): | 61.01 | |
| TEMA (21): | 4.764 | |
| Williams %R (14): | -52.05 | |
| Chande Momentum Oscillator (20): | 0.001 | |
| Repulse (5,40,3): | -1.0830 | |
| ROCnROLL: | -1 | |
| TRIX (15,9): | 0.3370 | |
| Courbe Coppock: | 14.41 |
| MA7: | 4.695 | |
| MA20: | 4.563 | |
| MA50: | 4.432 | |
| MA100: | 4.341 | |
| MAexp7: | 4.665 | |
| MAexp20: | 4.575 | |
| MAexp50: | 4.467 | |
| MAexp100: | 4.427 | |
| Price / MA7: | -1.24% | |
| Price / MA20: | +1.62% | |
| Price / MA50: | +4.63% | |
| Price / MA100: | +6.82% | |
| Price / MAexp7: | -0.60% | |
| Price / MAexp20: | +1.36% | |
| Price / MAexp50: | +3.81% | |
| Price / MAexp100: | +4.74% |
News
Don't forget to follow the news on AEGON. At the time of publication of this analysis, the latest news was as follows:
- Aegon reports third quarter 2022 results
- AM Best Affirms Credit Ratings of Aegon N.V.’s U.S. Subsidiaries
- Aegon takes note of equity issuance by a.s.r.
- Aegon completes sale of 50% stake in joint venture with Liberbank to Unicaja Banco
- Aegon to repurchase shares to neutralize 2022 interim dividend paid in shares
About author
Online


Add a comment
Comments
0 comments on the analysis AEGON - Daily