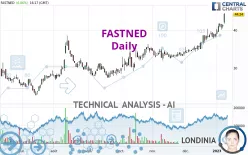
FASTNED - Daily - Technical analysis published on 01/09/2023 (GMT)
- 202
- 0
Click here for a new analysis!
- Timeframe : Daily
- - Analysis generated on
- Status : INVALID

Summary of the analysis

Additional analysis
Quotes
The FASTNED rating is 44.24 EUR. The price registered an increase of +6.86% on the session and was between 41.68 EUR and 44.48 EUR. This implies that the price is at +6.14% from its lowest and at -0.54% from its highest.The Central Gaps scanner detects the formation of a bullish gap marking the strong presence of buyers against sellers at the opening. This formed a quotation gap.
Opening Gap UP
Type : Bullish
Timeframe : Openning
A study of price movements over other periods shows the following variations:
New HIGH record (1st january)
Type : Bullish
Timeframe : Weekly
New HIGH record (1 month)
Type : Bullish
Timeframe : Weekly
Technical
Technical analysis of this Daily chart of FASTNED indicates that the overall trend is strongly bullish. 92.86% of the signals given by moving averages are bullish. This strongly bullish trend is supported by the strong bullish signals given by short-term moving averages. The Central Indicators market scanner currently does not detect any result that concerns moving averages.
The probability of a further increase is high given the direction of the technical indicators.
Caution: the Central Indicators scanner currently detects an excess:
RSI indicator is overbought : over 70
Type : Neutral
Timeframe : Daily
CCI indicator is overbought : over 100
Type : Neutral
Timeframe : Daily
Williams %R indicator is overbought : over -20
Type : Neutral
Timeframe : Daily
Pivot points : price is over resistance 2
Type : Neutral
Timeframe : Weekly
Pivot points : price is over resistance 3
Type : Neutral
Timeframe : Daily
The analysis of the price chart with Central Patterns scanners does not return any result.
The presence of a bullish Japanese candlestick pattern detected by Central Candlesticks that could cause a very short term rebound was also detected:
Upside gap
Type : Bullish
Timeframe : Daily
| S3 | S2 | S1 | Price | R1 | R2 | R3 | |
|---|---|---|---|---|---|---|---|
| ProTrendLines | 31.44 | 35.46 | 37.00 | 44.24 | 49.30 | 69.00 | 103.80 |
| Change (%) | -28.93% | -19.85% | -16.37% | - | +11.44% | +55.97% | +134.63% |
| Change | -12.80 | -8.78 | -7.24 | - | +5.06 | +24.76 | +59.56 |
| Level | Intermediate | Major | Intermediate | - | Minor | Minor | Major |
Attention could also be paid to pivot points to set price objectives:
| Pivot points | S3 | S2 | S1 | PP | R1 | R2 | R3 |
|---|---|---|---|---|---|---|---|
| Standard | 39.63 | 40.01 | 40.71 | 41.09 | 41.79 | 42.17 | 42.87 |
| Camarilla | 41.10 | 41.20 | 41.30 | 41.40 | 41.50 | 41.60 | 41.70 |
| Woodie | 39.78 | 40.09 | 40.86 | 41.17 | 41.94 | 42.25 | 43.02 |
| Fibonacci | 40.01 | 40.43 | 40.68 | 41.09 | 41.51 | 41.76 | 42.17 |
| Pivot points | S3 | S2 | S1 | PP | R1 | R2 | R3 |
|---|---|---|---|---|---|---|---|
| Standard | 35.87 | 37.09 | 39.25 | 40.47 | 42.63 | 43.85 | 46.01 |
| Camarilla | 40.47 | 40.78 | 41.09 | 41.40 | 41.71 | 42.02 | 42.33 |
| Woodie | 36.33 | 37.33 | 39.71 | 40.71 | 43.09 | 44.09 | 46.47 |
| Fibonacci | 37.09 | 38.38 | 39.18 | 40.47 | 41.76 | 42.56 | 43.85 |
| Pivot points | S3 | S2 | S1 | PP | R1 | R2 | R3 |
|---|---|---|---|---|---|---|---|
| Standard | 28.27 | 31.05 | 34.73 | 37.51 | 41.19 | 43.97 | 47.65 |
| Camarilla | 36.62 | 37.22 | 37.81 | 38.40 | 38.99 | 39.58 | 40.18 |
| Woodie | 28.71 | 31.28 | 35.17 | 37.74 | 41.63 | 44.20 | 48.09 |
| Fibonacci | 31.05 | 33.52 | 35.05 | 37.51 | 39.98 | 41.51 | 43.97 |
Numerical data
The following are the details of the technical indicators and moving averages that were collected to generate this technical analysis:
| RSI (14): | 76.42 | |
| MACD (12,26,9): | 1.9300 | |
| Directional Movement: | 31.19 | |
| AROON (14): | 100.00 | |
| DEMA (21): | 41.49 | |
| Parabolic SAR (0,02-0,02-0,2): | 38.40 | |
| Elder Ray (13): | 2.92 | |
| Super Trend (3,10): | 38.34 | |
| Zig ZAG (10): | 44.22 | |
| VORTEX (21): | 1.1900 | |
| Stochastique (14,3,5): | 92.20 | |
| TEMA (21): | 42.37 | |
| Williams %R (14): | -3.31 | |
| Chande Momentum Oscillator (20): | 5.86 | |
| Repulse (5,40,3): | 9.1400 | |
| ROCnROLL: | 1 | |
| TRIX (15,9): | 0.6200 | |
| Courbe Coppock: | 23.50 |
| MA7: | 41.04 | |
| MA20: | 38.72 | |
| MA50: | 35.78 | |
| MA100: | 33.22 | |
| MAexp7: | 41.38 | |
| MAexp20: | 39.11 | |
| MAexp50: | 36.47 | |
| MAexp100: | 34.52 | |
| Price / MA7: | +7.80% | |
| Price / MA20: | +14.26% | |
| Price / MA50: | +23.64% | |
| Price / MA100: | +33.17% | |
| Price / MAexp7: | +6.91% | |
| Price / MAexp20: | +13.12% | |
| Price / MAexp50: | +21.31% | |
| Price / MAexp100: | +28.16% |
About author
Online


Add a comment
Comments
0 comments on the analysis FASTNED - Daily