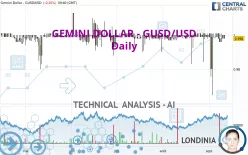
GEMINI DOLLAR - GUSD/USD - Daily - Technical analysis published on 09/11/2023 (GMT)
- 151
- 0
- Who voted?
Click here for a new analysis!
- Timeframe : Daily
- - Analysis generated on
- Status : LEVEL MAINTAINED

Summary of the analysis
Additional analysis
Quotes
GEMINI DOLLAR - GUSD/USD rating 0.998000 USD. On the day, this instrument lost -0.20% and was between 0.998000 USD and 1.000000 USD. This implies that the price is at 0% from its lowest and at -0.20% from its highest.A study of price movements over other periods shows the following variations:
Near a new LOW record (1 month)
Type : Bearish
Timeframe : Weekly
The Central Volumes scanner detects abnormal volumes on the asset:
Abnormal volumes
Timeframe : 5 days
Technical
Technical analysis of GEMINI DOLLAR - GUSD/USD in Daily shows a overall strongly bearish trend. The signals given by moving averages are 92.86% bearish. This strong bearish trend is confirmed by the strong signals currently being given by short-term moving averages. The Central Indicators scanner detects bearish signals on moving averages that could impact this trend:
Bearish price crossover with Moving Average 20
Type : Bearish
Timeframe : Daily
Bearish price crossover with Moving Average 50
Type : Bearish
Timeframe : Daily
Bearish price crossover with Moving Average 100
Type : Bearish
Timeframe : Daily
Bearish price crossover with adaptative moving average 100
Type : Bearish
Timeframe : Daily
On the 18 technical indicators analysed, 5 are bullish, 6 are neutral and 7 are bearish. Caution: the Central Indicators scanner currently detects an excess:
Williams %R indicator is overbought : over -20
Type : Neutral
Timeframe : Daily
Pivot points : price is under support 1
Type : Neutral
Timeframe : Daily
RSI indicator is back under 50
Type : Bearish
Timeframe : Daily
Momentum indicator is back under 0
Type : Bearish
Timeframe : Daily
The analysis of the price chart with Central Patterns scanners does not return any result.
The Central Candlesticks scanner, specialised in Japanese candlesticks, did not identify any signals.
| S3 | S2 | S1 | Price | R1 | R2 | R3 | |
|---|---|---|---|---|---|---|---|
| ProTrendLines | 0.980300 | 0.988150 | 0.997000 | 0.998000 | 1.001000 | 1.008000 | 1.030444 |
| Change (%) | -1.77% | -0.99% | -0.10% | - | +0.30% | +1.00% | +3.25% |
| Change | -0.017700 | -0.009850 | -0.001000 | - | +0.003000 | +0.010000 | +0.032444 |
| Level | Minor | Major | Intermediate | - | Major | Major | Minor |
To determine price objectives, it is also possible to use the pivot points. Here is the price position in relation to pivot points:
| Pivot points | S3 | S2 | S1 | PP | R1 | R2 | R3 |
|---|---|---|---|---|---|---|---|
| Standard | 0.996667 | 0.997333 | 0.998667 | 0.999333 | 1.000667 | 1.001333 | 1.002667 |
| Camarilla | 0.999450 | 0.999633 | 0.999817 | 1.000000 | 1.000183 | 1.000367 | 1.000550 |
| Woodie | 0.997000 | 0.997500 | 0.999000 | 0.999500 | 1.001000 | 1.001500 | 1.003000 |
| Fibonacci | 0.997333 | 0.998097 | 0.998569 | 0.999333 | 1.000097 | 1.000569 | 1.001333 |
| Pivot points | S3 | S2 | S1 | PP | R1 | R2 | R3 |
|---|---|---|---|---|---|---|---|
| Standard | 0.938667 | 0.951733 | 0.974867 | 0.987933 | 1.011067 | 1.024133 | 1.047267 |
| Camarilla | 0.988045 | 0.991363 | 0.994682 | 0.998000 | 1.001318 | 1.004637 | 1.007955 |
| Woodie | 0.943700 | 0.954250 | 0.979900 | 0.990450 | 1.016100 | 1.026650 | 1.052300 |
| Fibonacci | 0.951733 | 0.965562 | 0.974105 | 0.987933 | 1.001762 | 1.010305 | 1.024133 |
| Pivot points | S3 | S2 | S1 | PP | R1 | R2 | R3 |
|---|---|---|---|---|---|---|---|
| Standard | 0.970000 | 0.976600 | 0.987800 | 0.994400 | 1.005600 | 1.012200 | 1.023400 |
| Camarilla | 0.994105 | 0.995737 | 0.997368 | 0.999000 | 1.000632 | 1.002263 | 1.003895 |
| Woodie | 0.972300 | 0.977750 | 0.990100 | 0.995550 | 1.007900 | 1.013350 | 1.025700 |
| Fibonacci | 0.976600 | 0.983400 | 0.987600 | 0.994400 | 1.001200 | 1.005400 | 1.012200 |
Numerical data
The following are the details of the technical indicators and moving averages that were collected to generate this technical analysis:
| RSI (14): | 49.07 | |
| MACD (12,26,9): | -0.0001 | |
| Directional Movement: | -39.098550 | |
| AROON (14): | -42.857143 | |
| DEMA (21): | 0.998365 | |
| Parabolic SAR (0,02-0,02-0,2): | 1.001000 | |
| Elder Ray (13): | 0.000465 | |
| Super Trend (3,10): | 1.005941 | |
| Zig ZAG (10): | 0.998000 | |
| VORTEX (21): | 1.0468 | |
| Stochastique (14,3,5): | 93.55 | |
| TEMA (21): | 0.998393 | |
| Williams %R (14): | -8.29 | |
| Chande Momentum Oscillator (20): | -0.002000 | |
| Repulse (5,40,3): | -0.1179 | |
| ROCnROLL: | 2 | |
| TRIX (15,9): | -0.0045 | |
| Courbe Coppock: | 0.23 |
| MA7: | 0.999143 | |
| MA20: | 0.998615 | |
| MA50: | 0.999032 | |
| MA100: | 0.999068 | |
| MAexp7: | 0.998645 | |
| MAexp20: | 0.998589 | |
| MAexp50: | 0.998842 | |
| MAexp100: | 0.998946 | |
| Price / MA7: | -0.11% | |
| Price / MA20: | -0.06% | |
| Price / MA50: | -0.10% | |
| Price / MA100: | -0.11% | |
| Price / MAexp7: | -0.06% | |
| Price / MAexp20: | -0.06% | |
| Price / MAexp50: | -0.08% | |
| Price / MAexp100: | -0.09% |
About author

Online


Add a comment
Comments
0 comments on the analysis GEMINI DOLLAR - GUSD/USD - Daily