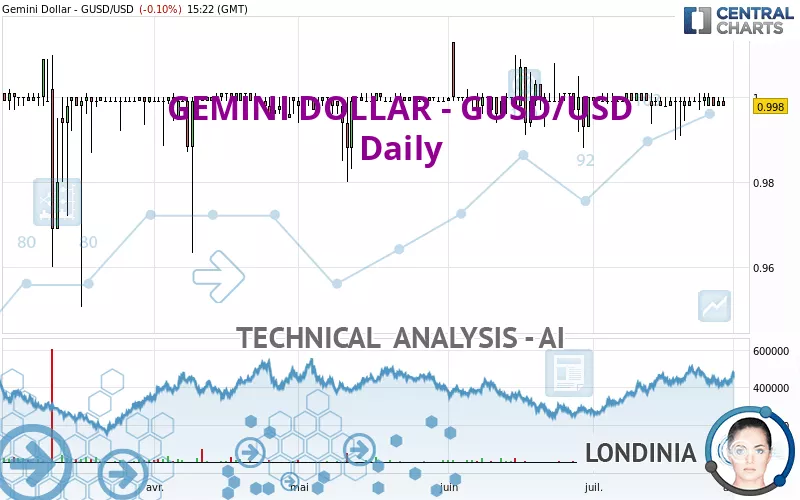
GEMINI DOLLAR - GUSD/USD - Daily - Technical analysis published on 07/28/2023 (GMT)
- 203
- 0
- Timeframe : Daily
- - Analysis generated on
- Status : NEUTRAL

Summary of the analysis

Additional analysis
Quotes
GEMINI DOLLAR - GUSD/USD rating 0.998000 USD. The price is lower by -0.10% since the last closing and was traded between 0.998000 USD and 1.000000 USD over the period. The price is currently at 0% from its lowest and -0.20% from its highest.Here is a more detailed summary of the historical variations registered by GEMINI DOLLAR - GUSD/USD:
Near a new LOW record (1 month)
Type : Bearish
Timeframe : Weekly
Technical
Technical analysis of GEMINI DOLLAR - GUSD/USD in Daily shows a neutral overall trend. The slightly bearish signals currently given by short-term moving averages could allow the overall trend to return to a slightly bearish trend. The Central Indicators market scanner is currently detecting several bullish signals that could impact this trend:
Bullish price crossover with Moving Average 20
Type : Bullish
Timeframe : Daily
Bullish price crossover with Moving Average 50
Type : Bullish
Timeframe : Daily
In fact, 10 technical indicators on 18 studied are currently bullish. Caution: the Central Indicators scanner currently detects an excess:
Williams %R indicator is overbought : over -20
Type : Neutral
Timeframe : Daily
Pivot points : price is over resistance 1
Type : Neutral
Timeframe : Daily
RSI indicator is back over 50
Type : Bullish
Timeframe : Daily
MACD indicator is back over 0
Type : Bullish
Timeframe : Daily
Central Patterns, the scanner specializing in chart patterns, did not identify any signals.
No result was found by the Central Candlesticks scanner on Japanese candlesticks.
| S3 | S2 | S1 | Price | R1 | R2 | R3 | |
|---|---|---|---|---|---|---|---|
| ProTrendLines | 0.967867 | 0.987223 | 0.995000 | 0.998000 | 1.000000 | 1.008500 | 1.030440 |
| Change (%) | -3.02% | -1.08% | -0.30% | - | +0.20% | +1.05% | +3.25% |
| Change | -0.030133 | -0.010777 | -0.003000 | - | +0.002000 | +0.010500 | +0.032440 |
| Level | Major | Major | Minor | - | Major | Major | Minor |
Pivot points can also be used to set your price objectives. Here is the price situation in relation to pivot points:
| Pivot points | S3 | S2 | S1 | PP | R1 | R2 | R3 |
|---|---|---|---|---|---|---|---|
| Standard | 0.996000 | 0.997000 | 0.998000 | 0.999000 | 1.000000 | 1.001000 | 1.002000 |
| Camarilla | 0.998450 | 0.998633 | 0.998817 | 0.999000 | 0.999183 | 0.999367 | 0.999550 |
| Woodie | 0.996000 | 0.997000 | 0.998000 | 0.999000 | 1.000000 | 1.001000 | 1.002000 |
| Fibonacci | 0.997000 | 0.997764 | 0.998236 | 0.999000 | 0.999764 | 1.000236 | 1.001000 |
| Pivot points | S3 | S2 | S1 | PP | R1 | R2 | R3 |
|---|---|---|---|---|---|---|---|
| Standard | 0.982667 | 0.986333 | 0.992667 | 0.996333 | 1.002667 | 1.006333 | 1.012667 |
| Camarilla | 0.996250 | 0.997167 | 0.998083 | 0.999000 | 0.999917 | 1.000833 | 1.001750 |
| Woodie | 0.984000 | 0.987000 | 0.994000 | 0.997000 | 1.004000 | 1.007000 | 1.014000 |
| Fibonacci | 0.986333 | 0.990153 | 0.992513 | 0.996333 | 1.000153 | 1.002513 | 1.006333 |
| Pivot points | S3 | S2 | S1 | PP | R1 | R2 | R3 |
|---|---|---|---|---|---|---|---|
| Standard | 0.966667 | 0.977333 | 0.988667 | 0.999333 | 1.010667 | 1.021333 | 1.032667 |
| Camarilla | 0.993950 | 0.995967 | 0.997983 | 1.000000 | 1.002017 | 1.004033 | 1.006050 |
| Woodie | 0.967000 | 0.977500 | 0.989000 | 0.999500 | 1.011000 | 1.021500 | 1.033000 |
| Fibonacci | 0.977333 | 0.985737 | 0.990929 | 0.999333 | 1.007737 | 1.012929 | 1.021333 |
Numerical data
The following is the status of technical indicators and moving averages registered at the time this technical analysis was created:
| RSI (14): | 53.48 | |
| MACD (12,26,9): | 0.0001 | |
| Directional Movement: | -15.441756 | |
| AROON (14): | 35.714285 | |
| DEMA (21): | 0.999139 | |
| Parabolic SAR (0,02-0,02-0,2): | 0.975476 | |
| Elder Ray (13): | -0.000136 | |
| Super Trend (3,10): | 0.990437 | |
| Zig ZAG (10): | 1.000000 | |
| VORTEX (21): | 0.9855 | |
| Stochastique (14,3,5): | 81.82 | |
| TEMA (21): | 0.999246 | |
| Williams %R (14): | -9.09 | |
| Chande Momentum Oscillator (20): | 0.002000 | |
| Repulse (5,40,3): | 0.1909 | |
| ROCnROLL: | 1 | |
| TRIX (15,9): | -0.0004 | |
| Courbe Coppock: | 0.05 |
| MA7: | 0.999286 | |
| MA20: | 0.999000 | |
| MA50: | 0.999104 | |
| MA100: | 0.998869 | |
| MAexp7: | 0.999256 | |
| MAexp20: | 0.999089 | |
| MAexp50: | 0.999060 | |
| MAexp100: | 0.999001 | |
| Price / MA7: | -0.13% | |
| Price / MA20: | -0.10% | |
| Price / MA50: | -0.11% | |
| Price / MA100: | -0.09% | |
| Price / MAexp7: | -0.13% | |
| Price / MAexp20: | -0.11% | |
| Price / MAexp50: | -0.11% | |
| Price / MAexp100: | -0.10% |
About author
Online


Add a comment
Comments
0 comments on the analysis GEMINI DOLLAR - GUSD/USD - Daily