EUROPEAN MEDICAL S - Daily - Technical analysis published on 02/19/2024 (GMT)
- 165
- 0
Click here for a new analysis!
- Timeframe : Daily
- - Analysis generated on
- Status : INVALID

Summary of the analysis

Additional analysis
Quotes
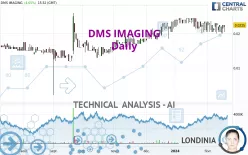
The DMS IMAGING price is 0.0225 EUR. On the day, this instrument gained +4.65% and was traded between 0.0205 EUR and 0.0225 EUR over the period. The price is currently at +9.76% from its lowest and 0% from its highest.A study of price movements over other periods shows the following variations:
Near a new LOW record (1st january)
Type : Bearish
Timeframe : Weekly
Near a new LOW record (1 month)
Type : Bearish
Timeframe : Weekly
Technical
Technical analysis of DMS IMAGING in Daily shows an overall bullish trend. 71.43% of the signals given by moving averages are bullish. Caution: the neutral signals currently given by the short-term moving averages indicate that this bullish trend is showing signs of running out of steam. The Central Indicators scanner detects bullish signals on moving averages that could impact this trend:
Bullish price crossover with Moving Average 20
Type : Bullish
Timeframe : Daily
Bullish price crossover with adaptative moving average 50
Type : Bullish
Timeframe : Daily
The technical indicators are generally neutral. They do not provide relevant information on the direction of future price movements.
Central Indicators, the detector scanner for these technical indicators has recently detected several signals:
RSI indicator is back over 50
Type : Bullish
Timeframe : Daily
Aroon indicator bearish trend
Type : Bearish
Timeframe : Daily
Ichimoku : price is over the cloud
Type : Bullish
Timeframe : Daily
Price is back over the pivot point
Type : Bullish
Timeframe : Weekly
Williams %R indicator is back over -50
Type : Bullish
Timeframe : Daily
No signals are given by Central Patterns, a market scanner specialised in chart patterns, resistances and supports.
The Central Candlesticks scanner which studies Japanese candlesticks did not detect anything.
| S3 | S2 | S1 | Price | R1 | R2 | R3 | |
|---|---|---|---|---|---|---|---|
| ProTrendLines | 0.0155 | 0.0175 | 0.0215 | 0.0225 | 0.0235 | 0.0245 | 0.1567 |
| Change (%) | -31.11% | -22.22% | -4.44% | - | +4.44% | +8.89% | +596.44% |
| Change | -0.0070 | -0.0050 | -0.0010 | - | +0.0010 | +0.0020 | +0.1342 |
| Level | Minor | Minor | Major | - | Minor | Intermediate | Minor |
Pivot points can also be used to set your price objectives. Here is the price situation in relation to pivot points:
| Pivot points | S3 | S2 | S1 | PP | R1 | R2 | R3 |
|---|---|---|---|---|---|---|---|
| Standard | 0.0192 | 0.0198 | 0.0212 | 0.0218 | 0.0232 | 0.0238 | 0.0252 |
| Camarilla | 0.0220 | 0.0221 | 0.0223 | 0.0225 | 0.0227 | 0.0229 | 0.0231 |
| Woodie | 0.0195 | 0.0200 | 0.0215 | 0.0220 | 0.0235 | 0.0240 | 0.0255 |
| Fibonacci | 0.0198 | 0.0206 | 0.0211 | 0.0218 | 0.0226 | 0.0231 | 0.0238 |
| Pivot points | S3 | S2 | S1 | PP | R1 | R2 | R3 |
|---|---|---|---|---|---|---|---|
| Standard | 0.0170 | 0.0185 | 0.0205 | 0.0220 | 0.0240 | 0.0255 | 0.0275 |
| Camarilla | 0.0215 | 0.0219 | 0.0222 | 0.0225 | 0.0228 | 0.0231 | 0.0235 |
| Woodie | 0.0173 | 0.0186 | 0.0208 | 0.0221 | 0.0243 | 0.0256 | 0.0278 |
| Fibonacci | 0.0185 | 0.0198 | 0.0207 | 0.0220 | 0.0233 | 0.0242 | 0.0255 |
| Pivot points | S3 | S2 | S1 | PP | R1 | R2 | R3 |
|---|---|---|---|---|---|---|---|
| Standard | 0.0160 | 0.0180 | 0.0205 | 0.0225 | 0.0250 | 0.0270 | 0.0295 |
| Camarilla | 0.0218 | 0.0222 | 0.0226 | 0.0230 | 0.0234 | 0.0238 | 0.0242 |
| Woodie | 0.0163 | 0.0181 | 0.0208 | 0.0226 | 0.0253 | 0.0271 | 0.0298 |
| Fibonacci | 0.0180 | 0.0197 | 0.0208 | 0.0225 | 0.0242 | 0.0253 | 0.0270 |
Numerical data
The following is the status of technical indicators and moving averages registered at the time this technical analysis was created:
| RSI (14): | 50.11 | |
| MACD (12,26,9): | -0.0001 | |
| Directional Movement: | 0.3455 | |
| AROON (14): | -57.1428 | |
| DEMA (21): | 0.0224 | |
| Parabolic SAR (0,02-0,02-0,2): | 0.0225 | |
| Elder Ray (13): | -0.0009 | |
| Super Trend (3,10): | 0.0195 | |
| Zig ZAG (10): | 0.0225 | |
| VORTEX (21): | 0.8750 | |
| Stochastique (14,3,5): | 57.14 | |
| TEMA (21): | 0.0219 | |
| Williams %R (14): | -28.57 | |
| Chande Momentum Oscillator (20): | -0.0005 | |
| Repulse (5,40,3): | 17.4406 | |
| ROCnROLL: | 1 | |
| TRIX (15,9): | -0.0322 | |
| Courbe Coppock: | 3.06 |
| MA7: | 0.0223 | |
| MA20: | 0.0225 | |
| MA50: | 0.0225 | |
| MA100: | 0.0196 | |
| MAexp7: | 0.0222 | |
| MAexp20: | 0.0225 | |
| MAexp50: | 0.0219 | |
| MAexp100: | 0.0207 | |
| Price / MA7: | +0.90% | |
| Price / MA20: | -0% | |
| Price / MA50: | -0% | |
| Price / MA100: | +14.80% | |
| Price / MAexp7: | +1.35% | |
| Price / MAexp20: | -0% | |
| Price / MAexp50: | +2.74% | |
| Price / MAexp100: | +8.70% |
News
Don't forget to follow the news on DMS IMAGING. At the time of publication of this analysis, the latest news was as follows:
- DMS IMAGING : End of the ongoing procedure with Thierry Legon and reinstatement of the judicial reorganization plan homologated on February 9, 2021.
- Record quarterly revenue: EUR 10.1 million in the 1st quarter of 2023, organic growth +16% - Confirmation of 2023 targets and perspectives
- 2022 revenue: EUR 35.3 m - 2023 targets and perspectives
- Fujifilm Healthcare Italy wins tender for 96 X-ray tables, designed and produced by DMS Imaging
- 2022 bi-annual results
About author
Online


Add a comment
Comments
0 comments on the analysis EUROPEAN MEDICAL S - Daily