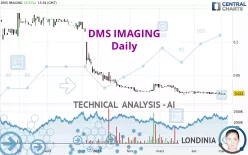
EUROPEAN MEDICAL S - Daily - Technical analysis published on 05/05/2023 (GMT)
- 198
- 0
Click here for a new analysis!
- Timeframe : Daily
- - Analysis generated on
- Status : TARGET REACHED

Summary of the analysis

Additional analysis
Quotes
The DMS IMAGING price is 0.0230 EUR. The price registered an increase of +9.52% on the session and was between 0.0205 EUR and 0.0230 EUR. This implies that the price is at +12.20% from its lowest and at 0% from its highest.Here is a more detailed summary of the historical variations registered by DMS IMAGING:
Near a new LOW record (5 years)
Type : Bearish
Timeframe : Weekly
Near a new LOW record (1 year)
Type : Bearish
Timeframe : Weekly
Near a new LOW record (1st january)
Type : Bearish
Timeframe : Weekly
New LOW record (1 month)
Type : Bearish
Timeframe : Weekly
The Central Volumes scanner notes the presence of abnormal volumes:
Abnormal volumes
Timeframe : 50 days
Technical
A technical analysis in Daily of this DMS IMAGING chart shows a sharp bearish trend. 85.71% of the signals given by moving averages are bearish. This strongly bearish trend is showing signs of slowing down given the slightly bearish signals given by short-term moving averages. The Central Indicators scanner detects a bullish signal on moving averages that could impact this trend:
Bullish price crossover with Moving Average 20
Type : Bullish
Timeframe : Daily
The probability of a further increase is slight given the direction of the technical indicators.
Other results related to technical indicators were also found by the Central Indicators scanner:
Pivot points : price is over resistance 3
Type : Neutral
Timeframe : Daily
Williams %R indicator is back over -50
Type : Bullish
Timeframe : Daily
An analysis of the price chart with the Central Patterns scanner (detector of chart patterns and resistances and supports) shows a result that can have an impact on the price change:
Near horizontal resistance
Type : Bearish
Timeframe : Daily
No result was found by the Central Candlesticks scanner on Japanese candlesticks.
| Price | R1 | R2 | R3 | |
|---|---|---|---|---|
| ProTrendLines | 0.0230 | 0.0251 | 0.1101 | 0.1300 |
| Change (%) | - | +9.13% | +378.70% | +465.22% |
| Change | - | +0.0021 | +0.0871 | +0.1070 |
| Level | - | Minor | Minor | Major |
To determine price objectives, it is also possible to use the pivot points. Here is the price position in relation to pivot points:
| Pivot points | S3 | S2 | S1 | PP | R1 | R2 | R3 |
|---|---|---|---|---|---|---|---|
| Standard | 0.0188 | 0.0197 | 0.0213 | 0.0222 | 0.0238 | 0.0247 | 0.0263 |
| Camarilla | 0.0223 | 0.0225 | 0.0228 | 0.0230 | 0.0232 | 0.0235 | 0.0237 |
| Woodie | 0.0193 | 0.0199 | 0.0218 | 0.0224 | 0.0243 | 0.0249 | 0.0268 |
| Fibonacci | 0.0197 | 0.0206 | 0.0212 | 0.0222 | 0.0231 | 0.0237 | 0.0247 |
| Pivot points | S3 | S2 | S1 | PP | R1 | R2 | R3 |
|---|---|---|---|---|---|---|---|
| Standard | 0.0183 | 0.0197 | 0.0213 | 0.0227 | 0.0243 | 0.0257 | 0.0273 |
| Camarilla | 0.0222 | 0.0225 | 0.0227 | 0.0230 | 0.0233 | 0.0236 | 0.0238 |
| Woodie | 0.0185 | 0.0198 | 0.0215 | 0.0228 | 0.0245 | 0.0258 | 0.0275 |
| Fibonacci | 0.0197 | 0.0208 | 0.0215 | 0.0227 | 0.0238 | 0.0245 | 0.0257 |
| Pivot points | S3 | S2 | S1 | PP | R1 | R2 | R3 |
|---|---|---|---|---|---|---|---|
| Standard | 0.0157 | 0.0183 | 0.0207 | 0.0233 | 0.0257 | 0.0283 | 0.0307 |
| Camarilla | 0.0216 | 0.0221 | 0.0225 | 0.0230 | 0.0235 | 0.0239 | 0.0244 |
| Woodie | 0.0155 | 0.0183 | 0.0205 | 0.0233 | 0.0255 | 0.0283 | 0.0305 |
| Fibonacci | 0.0183 | 0.0202 | 0.0214 | 0.0233 | 0.0252 | 0.0264 | 0.0283 |
Numerical data
The following are the details of the technical indicators and moving averages that were collected to generate this technical analysis:
| RSI (14): | 46.43 | |
| MACD (12,26,9): | -0.0013 | |
| Directional Movement: | -6.4291 | |
| AROON (14): | -100.0000 | |
| DEMA (21): | 0.0214 | |
| Parabolic SAR (0,02-0,02-0,2): | 0.0252 | |
| Elder Ray (13): | -0.0009 | |
| Super Trend (3,10): | 0.0273 | |
| Zig ZAG (10): | 0.0230 | |
| VORTEX (21): | 0.8321 | |
| Stochastique (14,3,5): | 20.83 | |
| TEMA (21): | 0.0220 | |
| Williams %R (14): | -37.50 | |
| Chande Momentum Oscillator (20): | -0.0015 | |
| Repulse (5,40,3): | 2.5478 | |
| ROCnROLL: | -1 | |
| TRIX (15,9): | -0.7864 | |
| Courbe Coppock: | 13.87 |
| MA7: | 0.0222 | |
| MA20: | 0.0230 | |
| MA50: | 0.0268 | |
| MA100: | 0.0392 | |
| MAexp7: | 0.0222 | |
| MAexp20: | 0.0232 | |
| MAexp50: | 0.0284 | |
| MAexp100: | 0.0465 | |
| Price / MA7: | +3.60% | |
| Price / MA20: | -0% | |
| Price / MA50: | -14.18% | |
| Price / MA100: | -41.33% | |
| Price / MAexp7: | +3.60% | |
| Price / MAexp20: | -0.86% | |
| Price / MAexp50: | -19.01% | |
| Price / MAexp100: | -50.54% |
News
The last news published on DMS IMAGING at the time of the generation of this analysis was as follows:
- Record quarterly revenue: EUR 10.1 million in the 1st quarter of 2023, organic growth +16% - Confirmation of 2023 targets and perspectives
- 2022 revenue: EUR 35.3 m - 2023 targets and perspectives
- Fujifilm Healthcare Italy wins tender for 96 X-ray tables, designed and produced by DMS Imaging
- 2022 bi-annual results
- DMS Imaging: Information on the Total Number of Voting Rights and Shares
About author
Online


Add a comment
Comments
0 comments on the analysis EUROPEAN MEDICAL S - Daily