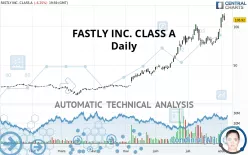
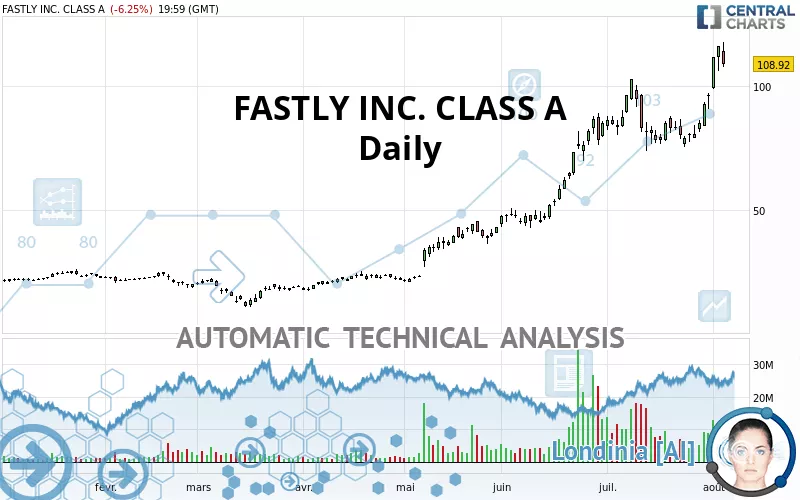
FASTLY INC. CLASS A - Daily - Technical analysis published on 08/06/2020 (GMT)
- 281
- 0
- Who voted?
Click here for a new analysis!
- Timeframe : Daily
- - Analysis generated on
- Status : INVALID
Summary of the analysis

Additional analysis
Quotes
The FASTLY INC. CLASS A rating is 108.92 USD. On the day, this instrument lost -6.25% with the lowest point at 107.57 USD and the highest point at 117.79 USD. The deviation from the price is +1.25% for the low point and -7.53% for the high point.The Central Gaps scanner detects a bearish opening marking the presence of sellers ahead of buyers at the opening but not sufficiently marked to allow the price to register a quotation gap.
Bearish opening
Type : Bearish
Timeframe : Openning
Here is a more detailed summary of the historical variations registered by FASTLY INC. CLASS A:
New HIGH record (1 year)
Type : Bullish
Timeframe : Weekly
New HIGH record (1st january)
Type : Bullish
Timeframe : Weekly
Abnormal volumes on FASTLY INC. CLASS A were detected by the Central Volumes scanner:
Abnormal volumes
Timeframe : 5 days
Abnormal volumes
Timeframe : 20 days
Abnormal volumes
Timeframe : 50 days
Technical
A technical analysis in Daily of this FASTLY INC. CLASS A chart shows a strongly bullish trend. 92.86% of the signals given by moving averages are bullish. The overall trend is supported by the strong bullish signals from short-term moving averages. An assessment of moving averages reveals a bearish signal that could impact this trend:
Moving Average bearish crossovers : AMA20 & AMA50
Type : Bearish
Timeframe : Daily
In fact, 13 technical indicators on 18 studied are currently positioned bullish. But beware of excesses. The Central Indicators scanner currently detects this:
CCI indicator is overbought : over 100
Type : Neutral
Timeframe : Daily
Previous candle closed over Bollinger bands
Type : Neutral
Timeframe : Daily
Williams %R indicator is overbought : over -20
Type : Neutral
Timeframe : Daily
Pivot points : price is over resistance 1
Type : Neutral
Timeframe : Weekly
Pivot points : price is under support 1
Type : Neutral
Timeframe : Daily
Price is back over the pivot point
Type : Bullish
Timeframe : Daily
No signals are given by Central Patterns, a market scanner specialised in chart patterns, resistances and supports.
No result was found by the Central Candlesticks scanner on Japanese candlesticks.
| S3 | S2 | S1 | Price | |
|---|---|---|---|---|
| ProTrendLines | 48.07 | 78.16 | 102.72 | 108.92 |
| Change (%) | -55.87% | -28.24% | -5.69% | - |
| Change | -60.85 | -30.76 | -6.20 | - |
| Level | Minor | Major | Major | - |
To determine price objectives, it is also possible to use the pivot points. Here is the price position in relation to pivot points:
| Pivot points | S3 | S2 | S1 | PP | R1 | R2 | R3 |
|---|---|---|---|---|---|---|---|
| Standard | 99.41 | 102.81 | 109.49 | 112.89 | 119.57 | 122.97 | 129.65 |
| Camarilla | 113.41 | 114.33 | 115.26 | 116.18 | 117.10 | 118.03 | 118.95 |
| Woodie | 101.06 | 103.63 | 111.14 | 113.71 | 121.22 | 123.79 | 131.30 |
| Fibonacci | 102.81 | 106.66 | 109.04 | 112.89 | 116.74 | 119.12 | 122.97 |
| Pivot points | S3 | S2 | S1 | PP | R1 | R2 | R3 |
|---|---|---|---|---|---|---|---|
| Standard | 63.82 | 70.62 | 83.55 | 90.35 | 103.28 | 110.08 | 123.01 |
| Camarilla | 91.06 | 92.87 | 94.68 | 96.49 | 98.30 | 100.11 | 101.92 |
| Woodie | 66.90 | 72.15 | 86.63 | 91.88 | 106.36 | 111.61 | 126.09 |
| Fibonacci | 70.62 | 78.15 | 82.81 | 90.35 | 97.88 | 102.54 | 110.08 |
| Pivot points | S3 | S2 | S1 | PP | R1 | R2 | R3 |
|---|---|---|---|---|---|---|---|
| Standard | 50.18 | 62.02 | 79.26 | 91.10 | 108.34 | 120.18 | 137.42 |
| Camarilla | 88.49 | 91.16 | 93.82 | 96.49 | 99.16 | 101.82 | 104.49 |
| Woodie | 52.87 | 63.37 | 81.95 | 92.45 | 111.03 | 121.53 | 140.11 |
| Fibonacci | 62.02 | 73.13 | 80.00 | 91.10 | 102.21 | 109.08 | 120.18 |
Numerical data
The following is the status of technical indicators and moving averages registered at the time this technical analysis was created:
| RSI (14): | 68.63 | |
| MACD (12,26,9): | 8.7700 | |
| Directional Movement: | 28.70 | |
| AROON (14): | 57.14 | |
| DEMA (21): | 101.72 | |
| Parabolic SAR (0,02-0,02-0,2): | 80.48 | |
| Elder Ray (13): | 17.38 | |
| Super Trend (3,10): | 88.50 | |
| Zig ZAG (10): | 108.92 | |
| VORTEX (21): | 1.1000 | |
| Stochastique (14,3,5): | 92.91 | |
| TEMA (21): | 103.21 | |
| Williams %R (14): | -20.84 | |
| Chande Momentum Oscillator (20): | 24.07 | |
| Repulse (5,40,3): | 8.4900 | |
| ROCnROLL: | 1 | |
| TRIX (15,9): | 1.1500 | |
| Courbe Coppock: | 37.87 |
| MA7: | 98.77 | |
| MA20: | 89.15 | |
| MA50: | 73.21 | |
| MA100: | 49.07 | |
| MAexp7: | 101.68 | |
| MAexp20: | 90.73 | |
| MAexp50: | 75.21 | |
| MAexp100: | 58.62 | |
| Price / MA7: | +10.28% | |
| Price / MA20: | +22.18% | |
| Price / MA50: | +48.78% | |
| Price / MA100: | +121.97% | |
| Price / MAexp7: | +7.12% | |
| Price / MAexp20: | +20.05% | |
| Price / MAexp50: | +44.82% | |
| Price / MAexp100: | +85.81% |
About author

Online


Add a comment
Comments
0 comments on the analysis FASTLY INC. CLASS A - Daily