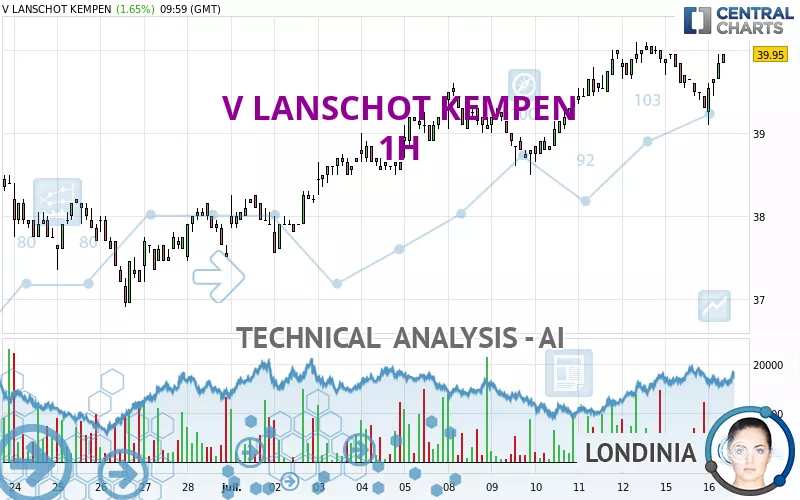
V LANSCHOT KEMPEN - 1H - Technical analysis published on 07/16/2024 (GMT)
- 151
- 0
Click here for a new analysis!
- Timeframe : 1H
- - Analysis generated on
- Status : INVALID

Summary of the analysis

Additional analysis
Quotes
V LANSCHOT KEMPEN rating 39.85 EUR. On the day, this instrument gained +1.40% and was traded between 39.10 EUR and 39.95 EUR over the period. The price is currently at +1.92% from its lowest and -0.25% from its highest.The Central Gaps scanner detects a bearish gap which is a sign that the sellers have taken the lead in the very short term.
Opening Gap DOWN
Type : Bearish
Timeframe : Openning
A study of price movements over other periods shows the following variations:
Near a new HIGH record (5 years)
Type : Bullish
Timeframe : Weekly
Near a new HIGH record (1 year)
Type : Bullish
Timeframe : Weekly
Near a new HIGH record (1st january)
Type : Bullish
Timeframe : Weekly
Near a new HIGH record (1 month)
Type : Bullish
Timeframe : Weekly
Technical
Technical analysis of this 1H chart of V LANSCHOT KEMPEN indicates that the overall trend is strongly bullish. 92.86% of the signals given by moving averages are bullish. The overall trend is supported by the strong bullish signals from short-term moving averages. An assessment of moving averages reveals several bullish signals that could impact this trend:
Bullish trend reversal : adaptative moving average 20
Type : Bullish
Timeframe : 1 hour
Bullish price crossover with Moving Average 20
Type : Bullish
Timeframe : 1 hour
Bullish price crossover with adaptative moving average 20
Type : Bullish
Timeframe : 1 hour
In fact, of the 18 technical indicators analysed by Central Analyzer, 10 are bullish, 4 are neutral and 4 are bearish. But beware of excesses. The Central Indicators scanner currently detects this:
Williams %R indicator is overbought : over -20
Type : Neutral
Timeframe : 1 hour
Pivot points : price is over resistance 1
Type : Neutral
Timeframe : 1 hour
Parabolic SAR indicator bullish reversal
Type : Bullish
Timeframe : 1 hour
Momentum indicator is back over 0
Type : Bullish
Timeframe : 1 hour
The analysis of the price chart with Central Patterns scanners does not return any result.
No result was found by the Central Candlesticks scanner on Japanese candlesticks.
| S3 | S2 | S1 | Price | R1 | |
|---|---|---|---|---|---|
| ProTrendLines | 38.50 | 39.30 | 39.60 | 39.85 | 40.10 |
| Change (%) | -3.39% | -1.38% | -0.63% | - | +0.63% |
| Change | -1.35 | -0.55 | -0.25 | - | +0.25 |
| Level | Major | Major | Intermediate | - | Minor |
To determine price objectives, it is also possible to use the pivot points. Here is the price position in relation to pivot points:
| Pivot points | S3 | S2 | S1 | PP | R1 | R2 | R3 |
|---|---|---|---|---|---|---|---|
| Standard | 38.43 | 38.87 | 39.08 | 39.52 | 39.73 | 40.17 | 40.38 |
| Camarilla | 39.12 | 39.18 | 39.24 | 39.30 | 39.36 | 39.42 | 39.48 |
| Woodie | 38.33 | 38.81 | 38.98 | 39.46 | 39.63 | 40.11 | 40.28 |
| Fibonacci | 38.87 | 39.12 | 39.27 | 39.52 | 39.77 | 39.92 | 40.17 |
| Pivot points | S3 | S2 | S1 | PP | R1 | R2 | R3 |
|---|---|---|---|---|---|---|---|
| Standard | 37.30 | 37.90 | 38.90 | 39.50 | 40.50 | 41.10 | 42.10 |
| Camarilla | 39.46 | 39.61 | 39.75 | 39.90 | 40.05 | 40.19 | 40.34 |
| Woodie | 37.50 | 38.00 | 39.10 | 39.60 | 40.70 | 41.20 | 42.30 |
| Fibonacci | 37.90 | 38.51 | 38.89 | 39.50 | 40.11 | 40.49 | 41.10 |
| Pivot points | S3 | S2 | S1 | PP | R1 | R2 | R3 |
|---|---|---|---|---|---|---|---|
| Standard | 32.30 | 34.30 | 35.90 | 37.90 | 39.50 | 41.50 | 43.10 |
| Camarilla | 36.51 | 36.84 | 37.17 | 37.50 | 37.83 | 38.16 | 38.49 |
| Woodie | 32.10 | 34.20 | 35.70 | 37.80 | 39.30 | 41.40 | 42.90 |
| Fibonacci | 34.30 | 35.68 | 36.53 | 37.90 | 39.28 | 40.13 | 41.50 |
Numerical data
The following is the status of technical indicators and moving averages registered at the time this technical analysis was created:
| RSI (14): | 59.47 | |
| MACD (12,26,9): | 0.0300 | |
| Directional Movement: | -6.38 | |
| AROON (14): | -85.71 | |
| DEMA (21): | 39.74 | |
| Parabolic SAR (0,02-0,02-0,2): | 39.10 | |
| Elder Ray (13): | 0.12 | |
| Super Trend (3,10): | 39.19 | |
| Zig ZAG (10): | 39.95 | |
| VORTEX (21): | 0.9000 | |
| Stochastique (14,3,5): | 60.61 | |
| TEMA (21): | 39.62 | |
| Williams %R (14): | -21.05 | |
| Chande Momentum Oscillator (20): | -0.05 | |
| Repulse (5,40,3): | 1.1400 | |
| ROCnROLL: | 1 | |
| TRIX (15,9): | 0.0200 | |
| Courbe Coppock: | 1.64 |
| MA7: | 39.49 | |
| MA20: | 38.60 | |
| MA50: | 37.99 | |
| MA100: | 34.29 | |
| MAexp7: | 39.66 | |
| MAexp20: | 39.68 | |
| MAexp50: | 39.48 | |
| MAexp100: | 39.10 | |
| Price / MA7: | +0.91% | |
| Price / MA20: | +3.24% | |
| Price / MA50: | +4.90% | |
| Price / MA100: | +16.21% | |
| Price / MAexp7: | +0.48% | |
| Price / MAexp20: | +0.43% | |
| Price / MAexp50: | +0.94% | |
| Price / MAexp100: | +1.92% |
News
The latest news and videos published on V LANSCHOT KEMPEN at the time of the analysis were as follows:
- Van Lanschot Kempen: update on share buy-back programme 5 March 2024 – 11 March 2024
- Van Lanschot Kempen announces early redemption of Additional Tier 1 notes
- Van Lanschot Kempen: update on share buy-back programme 27 February 2024 – 4 March 2024
- Van Lanschot Kempen publishes notice for its Additional Tier 1 holders
- Van Lanschot Kempen: net profit €125.2 million, with net AuM inflows at €5.3 billion in 2023
About author
Online


Add a comment
Comments
0 comments on the analysis V LANSCHOT KEMPEN - 1H