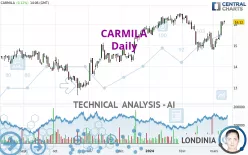
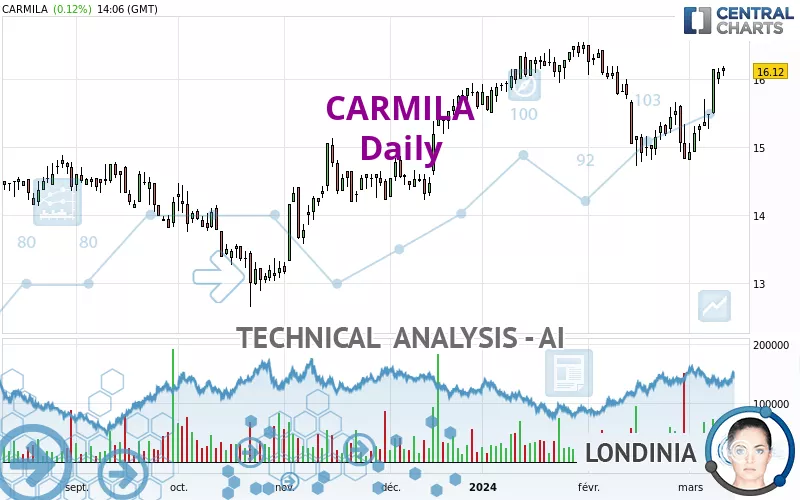
CARMILA - Daily - Technical analysis published on 03/12/2024 (GMT)
- 161
- 0
Click here for a new analysis!
- Timeframe : Daily
- - Analysis generated on
- Status : INVALID
Summary of the analysis

Additional analysis
Quotes
The CARMILA rating is 16.12 EUR. On the day, this instrument gained +0.12% and was between 16.04 EUR and 16.18 EUR. This implies that the price is at +0.50% from its lowest and at -0.37% from its highest.A bullish opening was detected by the Central Gaps scanner. Buyers are trying to impose a bullish momentum in the very short term.
Bullish opening
Type : Bullish
Timeframe : Openning
Here is a more detailed summary of the historical variations registered by CARMILA:
Near a new HIGH record (5 years)
Type : Bullish
Timeframe : Weekly
Near a new HIGH record (1 year)
Type : Bullish
Timeframe : Weekly
Near a new HIGH record (1st january)
Type : Bullish
Timeframe : Weekly
New HIGH record (1 month)
Type : Bullish
Timeframe : Weekly
Technical
A technical analysis in Daily of this CARMILA chart shows a strongly bullish trend. 89.29% of the signals given by moving averages are bullish. The overall trend is supported by the strong bullish signals from short-term moving averages. The Central Indicators scanner does not detect any result on moving averages that would impact this trend.
In fact, 16 technical indicators on 18 studied are currently positioned bullish. Caution: the Central Indicators scanner currently detects an excess:
CCI indicator is overbought : over 100
Type : Neutral
Timeframe : Daily
Previous candle closed over Bollinger bands
Type : Neutral
Timeframe : Daily
Williams %R indicator is overbought : over -20
Type : Neutral
Timeframe : Daily
The analysis of the price chart with Central Patterns scanners does not return any result.
No result was found by the Central Candlesticks scanner on Japanese candlesticks.
| S3 | S2 | S1 | Price | R1 | R2 | R3 | |
|---|---|---|---|---|---|---|---|
| ProTrendLines | 14.15 | 14.74 | 15.85 | 16.12 | 16.50 | 18.78 | 26.39 |
| Change (%) | -12.22% | -8.56% | -1.67% | - | +2.36% | +16.50% | +63.71% |
| Change | -1.97 | -1.38 | -0.27 | - | +0.38 | +2.66 | +10.27 |
| Level | Intermediate | Major | Major | - | Intermediate | Minor | Intermediate |
Attention could also be paid to pivot points to set price objectives:
| Pivot points | S3 | S2 | S1 | PP | R1 | R2 | R3 |
|---|---|---|---|---|---|---|---|
| Standard | 15.72 | 15.82 | 15.96 | 16.06 | 16.20 | 16.30 | 16.44 |
| Camarilla | 16.03 | 16.06 | 16.08 | 16.10 | 16.12 | 16.14 | 16.17 |
| Woodie | 15.74 | 15.83 | 15.98 | 16.07 | 16.22 | 16.31 | 16.46 |
| Fibonacci | 15.82 | 15.91 | 15.97 | 16.06 | 16.15 | 16.21 | 16.30 |
| Pivot points | S3 | S2 | S1 | PP | R1 | R2 | R3 |
|---|---|---|---|---|---|---|---|
| Standard | 14.11 | 14.51 | 15.33 | 15.73 | 16.55 | 16.95 | 17.77 |
| Camarilla | 15.81 | 15.92 | 16.03 | 16.14 | 16.25 | 16.36 | 16.48 |
| Woodie | 14.31 | 14.62 | 15.53 | 15.84 | 16.75 | 17.06 | 17.97 |
| Fibonacci | 14.51 | 14.98 | 15.27 | 15.73 | 16.20 | 16.49 | 16.95 |
| Pivot points | S3 | S2 | S1 | PP | R1 | R2 | R3 |
|---|---|---|---|---|---|---|---|
| Standard | 12.41 | 13.57 | 14.19 | 15.35 | 15.97 | 17.13 | 17.75 |
| Camarilla | 14.33 | 14.49 | 14.66 | 14.82 | 14.98 | 15.15 | 15.31 |
| Woodie | 12.15 | 13.44 | 13.93 | 15.22 | 15.71 | 17.00 | 17.49 |
| Fibonacci | 13.57 | 14.25 | 14.67 | 15.35 | 16.03 | 16.45 | 17.13 |
Numerical data
The following are the details of the technical indicators and moving averages that were collected to generate this technical analysis:
| RSI (14): | 62.12 | |
| MACD (12,26,9): | 0.0500 | |
| Directional Movement: | 14.56 | |
| AROON (14): | 50.00 | |
| DEMA (21): | 15.55 | |
| Parabolic SAR (0,02-0,02-0,2): | 14.96 | |
| Elder Ray (13): | 0.52 | |
| Super Trend (3,10): | 15.09 | |
| Zig ZAG (10): | 16.12 | |
| VORTEX (21): | 1.0200 | |
| Stochastique (14,3,5): | 97.08 | |
| TEMA (21): | 15.65 | |
| Williams %R (14): | -4.35 | |
| Chande Momentum Oscillator (20): | 0.94 | |
| Repulse (5,40,3): | 3.0100 | |
| ROCnROLL: | 1 | |
| TRIX (15,9): | -0.1200 | |
| Courbe Coppock: | 6.66 |
| MA7: | 15.66 | |
| MA20: | 15.30 | |
| MA50: | 15.79 | |
| MA100: | 15.12 | |
| MAexp7: | 15.76 | |
| MAexp20: | 15.55 | |
| MAexp50: | 15.52 | |
| MAexp100: | 15.24 | |
| Price / MA7: | +2.94% | |
| Price / MA20: | +5.36% | |
| Price / MA50: | +2.09% | |
| Price / MA100: | +6.61% | |
| Price / MAexp7: | +2.28% | |
| Price / MAexp20: | +3.67% | |
| Price / MAexp50: | +3.87% | |
| Price / MAexp100: | +5.77% |
News
Don't forget to follow the news on CARMILA. At the time of publication of this analysis, the latest news was as follows:
- Carmila: Resources Devoted to the Liquidity Contract as of 31 December 2023
- Carmila: Asset Sale in France for €35 Million
- CARMILA: Information Concerning the Total Number of Voting Rights and Share, Provided Pursuant to Article L.233-8 II of the Code de commerce (French Commercial Code) and Article 223-16 of the Règlement général de l’Autorité des marchés financiers
- Carmila: 2023 Half-Year Financial Report Available
- Carmila: 2023 Half-Year Results
About author

Online


Add a comment
Comments
0 comments on the analysis CARMILA - Daily