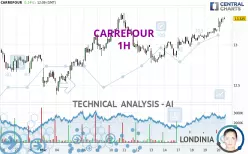
CARREFOUR - 1H - Technical analysis published on 03/20/2025 (GMT)
- 70
- 0
- Timeframe : 1H
- - Analysis generated on
- Status : IN PROGRESS...

Summary of the analysis

Additional analysis
Quotes
CARREFOUR rating 13.325 EUR. The price has increased by +1.14% since the last closing and was between 13.165 EUR and 13.350 EUR. This implies that the price is at +1.22% from its lowest and at -0.19% from its highest.So that you have an overall view of the price change, here is a table showing the variations over several periods:
Near a new HIGH record (1 month)
Type : Bullish
Timeframe : Weekly
Technical
Technical analysis of this 1H chart of CARREFOUR indicates that the overall trend is strongly bullish. 92.86% of the signals given by moving averages are bullish. The overall trend is supported by the strong bullish signals from short-term moving averages. There is no crossing of moving average by the price or crossing of moving averages between themselves.
In fact, 16 technical indicators on 18 studied are currently positioned bullish. Central Indicators, the detector scanner for these technical indicators has recently detected several signals:
Pivot points : price is over resistance 1 (Daily)
Type : Neutral
Timeframe : Weekly
Pivot points : price is over resistance 2 (Daily)
Type : Neutral
Timeframe : 1 hour
Pivot points : price is over resistance 1 (Weekly)
Type : Neutral
Timeframe : 1 hour
Pivot points : price is over resistance 1 (Monthly)
Type : Neutral
Timeframe : 1 hour
An analysis of the price chart with the Central Patterns scanner (detector of chart patterns and resistances and supports) shows a result that can have an impact on the price change:
Near resistance of channel
Type : Bearish
Timeframe : 1 hour
For a small setback in the very short term, the Central Candlesticks scanner currently notes the presence of this bearish pattern in Japanese candlesticks:
Bearish engulfing lines
Type : Bearish
Timeframe : 1 hour
| S3 | S2 | S1 | Price | R1 | R2 | R3 | |
|---|---|---|---|---|---|---|---|
| ProTrendLines | 12.649 | 12.870 | 13.167 | 13.325 | 13.490 | 13.640 | 13.910 |
| Change (%) | -5.07% | -3.41% | -1.19% | - | +1.24% | +2.36% | +4.39% |
| Change | -0.676 | -0.455 | -0.158 | - | +0.165 | +0.315 | +0.585 |
| Level | Minor | Intermediate | Major | - | Intermediate | Minor | Minor |
Pivot points can also be used to set your price objectives. Here is the price situation in relation to pivot points:
| Pivot points | S3 | S2 | S1 | PP | R1 | R2 | R3 |
|---|---|---|---|---|---|---|---|
| Standard | 12.937 | 12.998 | 13.087 | 13.148 | 13.237 | 13.298 | 13.387 |
| Camarilla | 13.134 | 13.148 | 13.161 | 13.175 | 13.189 | 13.203 | 13.216 |
| Woodie | 12.950 | 13.005 | 13.100 | 13.155 | 13.250 | 13.305 | 13.400 |
| Fibonacci | 12.998 | 13.056 | 13.091 | 13.148 | 13.206 | 13.241 | 13.298 |
| Pivot points | S3 | S2 | S1 | PP | R1 | R2 | R3 |
|---|---|---|---|---|---|---|---|
| Standard | 12.040 | 12.405 | 12.665 | 13.030 | 13.290 | 13.655 | 13.915 |
| Camarilla | 12.753 | 12.810 | 12.868 | 12.925 | 12.982 | 13.040 | 13.097 |
| Woodie | 11.988 | 12.379 | 12.613 | 13.004 | 13.238 | 13.629 | 13.863 |
| Fibonacci | 12.405 | 12.644 | 12.791 | 13.030 | 13.269 | 13.416 | 13.655 |
| Pivot points | S3 | S2 | S1 | PP | R1 | R2 | R3 |
|---|---|---|---|---|---|---|---|
| Standard | 10.280 | 11.285 | 12.045 | 13.050 | 13.810 | 14.815 | 15.575 |
| Camarilla | 12.320 | 12.481 | 12.643 | 12.805 | 12.967 | 13.129 | 13.290 |
| Woodie | 10.158 | 11.224 | 11.923 | 12.989 | 13.688 | 14.754 | 15.453 |
| Fibonacci | 11.285 | 11.959 | 12.376 | 13.050 | 13.724 | 14.141 | 14.815 |
Numerical data
The following are the details of the technical indicators and moving averages that were collected to generate this technical analysis:
| RSI (14): | 72.01 | |
| MACD (12,26,9): | 0.0670 | |
| Directional Movement: | 20.368 | |
| AROON (14): | 85.714 | |
| DEMA (21): | 13.254 | |
| Parabolic SAR (0,02-0,02-0,2): | 13.165 | |
| Elder Ray (13): | 0.099 | |
| Super Trend (3,10): | 13.117 | |
| Zig ZAG (10): | 13.310 | |
| VORTEX (21): | 1.2080 | |
| Stochastique (14,3,5): | 89.02 | |
| TEMA (21): | 13.288 | |
| Williams %R (14): | -10.71 | |
| Chande Momentum Oscillator (20): | 0.195 | |
| Repulse (5,40,3): | 0.4600 | |
| ROCnROLL: | 1 | |
| TRIX (15,9): | 0.0580 | |
| Courbe Coppock: | 2.32 |
| MA7: | 13.051 | |
| MA20: | 12.924 | |
| MA50: | 13.373 | |
| MA100: | 13.802 | |
| MAexp7: | 13.256 | |
| MAexp20: | 13.171 | |
| MAexp50: | 13.088 | |
| MAexp100: | 13.047 | |
| Price / MA7: | +2.10% | |
| Price / MA20: | +3.10% | |
| Price / MA50: | -0.36% | |
| Price / MA100: | -3.46% | |
| Price / MAexp7: | +0.52% | |
| Price / MAexp20: | +1.17% | |
| Price / MAexp50: | +1.81% | |
| Price / MAexp100: | +2.13% |
News
Don't forget to follow the news on CARREFOUR. At the time of publication of this analysis, the latest news was as follows:
- Carrefour Belgium Partners with VyOS Networks to Transform Cloud-Native Retail Networking
- Carrefour and MoneyGram Join Forces to Broaden Financial Service Offerings to Carrefour Customers
- First Store in Yilan City, Taiwan! 2ND STREET TAIWAN CO., LTD. to Open an Eighteenth Store in Taiwan, 2nd STREET Carrefour Yilan Store, on March 17, 2023
- The Centre commits over $800,000 to the Ottawa Food Bank, Carrefour Solidaire Community Food Centre, and the Northern Manitoba Food, Culture, and Community Collaborative
- Carrefour: Information Concerning the Total Number of Voting Rights and Shares, Provided Pursuant to Article L.233-8 II of the Code de commerce (French Commercial Code) and article 223-16 of the Règlement général de l’Autorité des marchés financiers
About author
Online


Add a comment
Comments
0 comments on the analysis CARREFOUR - 1H