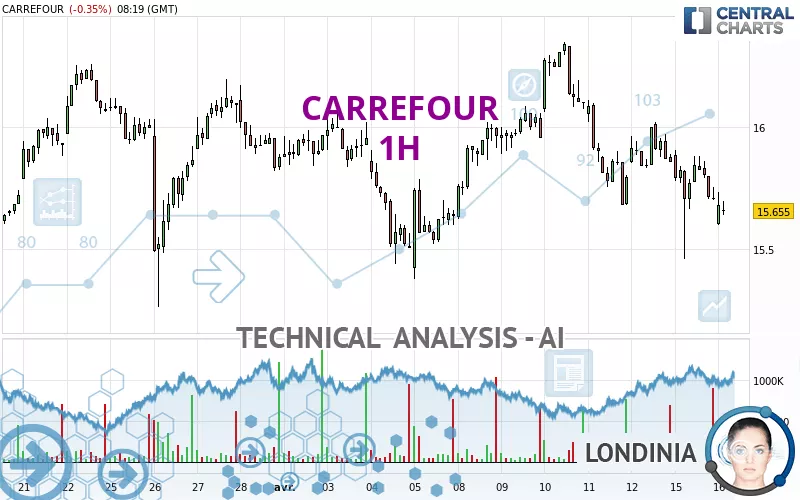
CARREFOUR - 1H - Technical analysis published on 04/16/2024 (GMT)
- 146
- 0
Click here for a new analysis!
- Timeframe : 1H
- - Analysis generated on
- Status : TARGET REACHED
Summary of the analysis

Additional analysis
Quotes
CARREFOUR rating 15.685 EUR. The price registered a decrease of -0.16% on the session and was traded between 15.600 EUR and 15.735 EUR over the period. The price is currently at +0.54% from its lowest and -0.32% from its highest.The Central Gaps scanner detects a bearish opening marking the presence of sellers ahead of buyers at the opening but not sufficiently marked to allow the price to register a quotation gap.
Bearish opening
Type : Bearish
Timeframe : Openning
Here is a more detailed summary of the historical variations registered by CARREFOUR:
Near a new LOW record (1 year)
Type : Bearish
Timeframe : Weekly
Near a new LOW record (1st january)
Type : Bearish
Timeframe : Weekly
Near a new HIGH record (1 month)
Type : Bullish
Timeframe : Weekly
Technical
Technical analysis of CARREFOUR in 1H shows a overall strongly bearish trend. 89.29% of the signals given by moving averages are bearish. The overall trend is supported by the strong bearish signals from short-term moving averages. The Central Indicators scanner does not detect any result on moving averages that would impact this trend.
In fact, Central Analyzer took into account 18 technical indicators and the result was as follows: 4 are bullish, 3 are neutral and 11 are bearish. Caution: the Central Indicators scanner currently detects an excess:
CCI indicator is oversold : under -100
Type : Neutral
Timeframe : 1 hour
CCI indicator: bullish divergence
Type : Bullish
Timeframe : 1 hour
The Central Patterns scanner, which studies chart patterns, resistances and supports, has identified these signals:
Near horizontal support
Type : Bullish
Timeframe : 1 hour
Support of channel is broken
Type : Bearish
Timeframe : 1 hour
The presence of these bearish patterns in Japanese candlesticks detected by Central Candlesticks that could cause a correction in the very short term were also noted
Bearish harami
Type : Bearish
Timeframe : 1 hour
Bearish harami cross
Type : Bearish
Timeframe : 1 hour
| S3 | S2 | S1 | Price | R1 | R2 | R3 | |
|---|---|---|---|---|---|---|---|
| ProTrendLines | 15.380 | 15.590 | 15.680 | 15.685 | 15.822 | 16.020 | 16.275 |
| Change (%) | -1.94% | -0.61% | -0.03% | - | +0.87% | +2.14% | +3.76% |
| Change | -0.305 | -0.095 | -0.005 | - | +0.137 | +0.335 | +0.590 |
| Level | Minor | Major | Intermediate | - | Minor | Intermediate | Major |
Pivot points can also be used to set your price objectives. Here is the price situation in relation to pivot points:
| Pivot points | S3 | S2 | S1 | PP | R1 | R2 | R3 |
|---|---|---|---|---|---|---|---|
| Standard | 15.033 | 15.247 | 15.478 | 15.692 | 15.923 | 16.137 | 16.368 |
| Camarilla | 15.588 | 15.628 | 15.669 | 15.710 | 15.751 | 15.792 | 15.832 |
| Woodie | 15.043 | 15.251 | 15.488 | 15.696 | 15.933 | 16.141 | 16.378 |
| Fibonacci | 15.247 | 15.417 | 15.522 | 15.692 | 15.862 | 15.967 | 16.137 |
| Pivot points | S3 | S2 | S1 | PP | R1 | R2 | R3 |
|---|---|---|---|---|---|---|---|
| Standard | 14.818 | 15.222 | 15.538 | 15.942 | 16.258 | 16.662 | 16.978 |
| Camarilla | 15.657 | 15.723 | 15.789 | 15.855 | 15.921 | 15.987 | 16.053 |
| Woodie | 14.775 | 15.200 | 15.495 | 15.920 | 16.215 | 16.640 | 16.935 |
| Fibonacci | 15.222 | 15.497 | 15.667 | 15.942 | 16.217 | 16.387 | 16.662 |
| Pivot points | S3 | S2 | S1 | PP | R1 | R2 | R3 |
|---|---|---|---|---|---|---|---|
| Standard | 14.352 | 14.808 | 15.342 | 15.798 | 16.332 | 16.788 | 17.322 |
| Camarilla | 15.603 | 15.694 | 15.784 | 15.875 | 15.966 | 16.057 | 16.147 |
| Woodie | 14.390 | 14.828 | 15.380 | 15.818 | 16.370 | 16.808 | 17.360 |
| Fibonacci | 14.808 | 15.187 | 15.420 | 15.798 | 16.177 | 16.410 | 16.788 |
Numerical data
The following are the details of the technical indicators and moving averages that were collected to generate this technical analysis:
| RSI (14): | 39.26 | |
| MACD (12,26,9): | -0.0600 | |
| Directional Movement: | -24.516 | |
| AROON (14): | -42.857 | |
| DEMA (21): | 15.730 | |
| Parabolic SAR (0,02-0,02-0,2): | 15.860 | |
| Elder Ray (13): | -0.103 | |
| Super Trend (3,10): | 15.970 | |
| Zig ZAG (10): | 15.690 | |
| VORTEX (21): | 0.9520 | |
| Stochastique (14,3,5): | 43.01 | |
| TEMA (21): | 15.693 | |
| Williams %R (14): | -54.90 | |
| Chande Momentum Oscillator (20): | -0.180 | |
| Repulse (5,40,3): | 0.3070 | |
| ROCnROLL: | 2 | |
| TRIX (15,9): | -0.0460 | |
| Courbe Coppock: | 1.89 |
| MA7: | 15.866 | |
| MA20: | 15.855 | |
| MA50: | 15.690 | |
| MA100: | 16.144 | |
| MAexp7: | 15.732 | |
| MAexp20: | 15.802 | |
| MAexp50: | 15.861 | |
| MAexp100: | 15.870 | |
| Price / MA7: | -1.14% | |
| Price / MA20: | -1.07% | |
| Price / MA50: | -0.03% | |
| Price / MA100: | -2.84% | |
| Price / MAexp7: | -0.30% | |
| Price / MAexp20: | -0.74% | |
| Price / MAexp50: | -1.11% | |
| Price / MAexp100: | -1.17% |
News
The latest news and videos published on CARREFOUR at the time of the analysis were as follows:
- Carrefour and MoneyGram Join Forces to Broaden Financial Service Offerings to Carrefour Customers
- First Store in Yilan City, Taiwan! 2ND STREET TAIWAN CO., LTD. to Open an Eighteenth Store in Taiwan, 2nd STREET Carrefour Yilan Store, on March 17, 2023
- The Centre commits over $800,000 to the Ottawa Food Bank, Carrefour Solidaire Community Food Centre, and the Northern Manitoba Food, Culture, and Community Collaborative
- Carrefour: Information Concerning the Total Number of Voting Rights and Shares, Provided Pursuant to Article L.233-8 II of the Code de commerce (French Commercial Code) and article 223-16 of the Règlement général de l’Autorité des marchés financiers
- Carrefour expands branded Gift Card partnership with Blackhawk Network across its territories
About author
Online


Add a comment
Comments
0 comments on the analysis CARREFOUR - 1H