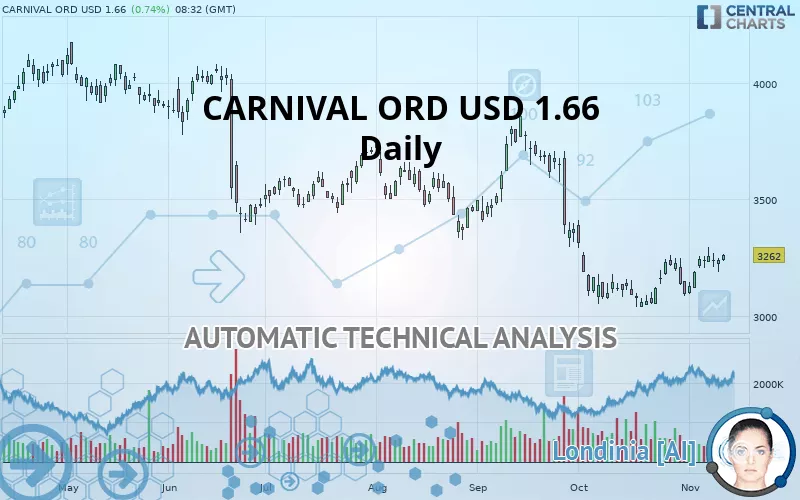
CARNIVAL ORD USD 1.66 - Daily - Technical analysis published on 11/12/2019 (GMT)
- 270
- 0
- Who voted?
Click here for a new analysis!
- Timeframe : Daily
- - Analysis generated on
- Status : TARGET REACHED
Summary of the analysis

Additional analysis
Quotes
CARNIVAL ORD USD 1.66 rating 3,262 GBX. The price registered an increase of +0.74% on the session and was traded between 3,235 GBX and 3,266 GBX over the period. The price is currently at +0.83% from its lowest and -0.12% from its highest.The Central Gaps scanner detects a bullish opening. A small advantage for buyers in the very short term.
Bullish opening
Type : Bullish
Timeframe : Openning
Here is a more detailed summary of the historical variations registered by CARNIVAL ORD USD 1.66:
Near a new HIGH record (1 month)
Type : Bullish
Timeframe : Weekly
Technical
Technical analysis of CARNIVAL ORD USD 1.66 in Daily shows an overall bearish trend. 71.43% of the signals given by moving averages are bearish. Caution: the neutral signals currently given by short-term moving averages show us that the global trend is losing momentum. There is no crossing of moving average by the price or crossing of moving averages between themselves.
The technical indicators are bullish. There is still some doubt about the price increase.
Caution: the Central Indicators scanner currently detects an excess:
Williams %R indicator is overbought : over -20
Type : Neutral
Timeframe : Daily
Pivot points : price is over resistance 1
Type : Neutral
Timeframe : Daily
Price is back over the pivot point
Type : Bullish
Timeframe : Weekly
The Central Patterns scanner, which studies chart patterns, resistances and supports, has identified these signals:
Near support of channel
Type : Bullish
Timeframe : Daily
Horizontal support is broken
Type : Bearish
Timeframe : Daily
The Central Candlesticks scanner which studies Japanese candlesticks did not detect anything.
| S3 | S2 | S1 | Price | R1 | R2 | R3 | |
|---|---|---|---|---|---|---|---|
| ProTrendLines | 2,957 | 3,090 | 3,229 | 3,262 | 3,360 | 3,667 | 3,859 |
| Change (%) | -9.35% | -5.27% | -1.01% | - | +3.00% | +12.42% | +18.30% |
| Change | -305 | -172 | -33 | - | +98 | +405 | +597 |
| Level | Intermediate | Major | Intermediate | - | Major | Major | Minor |
To determine price objectives, it is also possible to use the pivot points. Here is the price position in relation to pivot points:
| Pivot points | S3 | S2 | S1 | PP | R1 | R2 | R3 |
|---|---|---|---|---|---|---|---|
| Standard | 3,141 | 3,163 | 3,201 | 3,223 | 3,261 | 3,283 | 3,321 |
| Camarilla | 3,222 | 3,227 | 3,233 | 3,238 | 3,244 | 3,249 | 3,255 |
| Woodie | 3,148 | 3,167 | 3,208 | 3,227 | 3,268 | 3,287 | 3,328 |
| Fibonacci | 3,163 | 3,186 | 3,200 | 3,223 | 3,246 | 3,260 | 3,283 |
| Pivot points | S3 | S2 | S1 | PP | R1 | R2 | R3 |
|---|---|---|---|---|---|---|---|
| Standard | 2,963 | 3,040 | 3,139 | 3,216 | 3,315 | 3,392 | 3,491 |
| Camarilla | 3,189 | 3,205 | 3,221 | 3,237 | 3,253 | 3,269 | 3,285 |
| Woodie | 2,973 | 3,046 | 3,149 | 3,222 | 3,325 | 3,398 | 3,501 |
| Fibonacci | 3,040 | 3,108 | 3,149 | 3,216 | 3,284 | 3,325 | 3,392 |
| Pivot points | S3 | S2 | S1 | PP | R1 | R2 | R3 |
|---|---|---|---|---|---|---|---|
| Standard | 2,574 | 2,805 | 2,949 | 3,180 | 3,324 | 3,555 | 3,699 |
| Camarilla | 2,989 | 3,023 | 3,058 | 3,092 | 3,126 | 3,161 | 3,195 |
| Woodie | 2,530 | 2,783 | 2,905 | 3,158 | 3,280 | 3,533 | 3,655 |
| Fibonacci | 2,805 | 2,949 | 3,037 | 3,180 | 3,324 | 3,412 | 3,555 |
Numerical data
The following are the details of the technical indicators and moving averages that were collected to generate this technical analysis:
| RSI (14): | 54.00 | |
| MACD (12,26,9): | -7.0000 | |
| Directional Movement: | 1 | |
| AROON (14): | 79 | |
| DEMA (21): | 3,181 | |
| Parabolic SAR (0,02-0,02-0,2): | 3,114 | |
| Elder Ray (13): | 40 | |
| Super Trend (3,10): | 3,289 | |
| Zig ZAG (10): | 3,261 | |
| VORTEX (21): | 1.0000 | |
| Stochastique (14,3,5): | 79.00 | |
| TEMA (21): | 3,236 | |
| Williams %R (14): | -16.00 | |
| Chande Momentum Oscillator (20): | 32 | |
| Repulse (5,40,3): | 2.0000 | |
| ROCnROLL: | -1 | |
| TRIX (15,9): | 0.0000 | |
| Courbe Coppock: | 7.00 |
| MA7: | 3,236 | |
| MA20: | 3,165 | |
| MA50: | 3,334 | |
| MA100: | 3,436 | |
| MAexp7: | 3,230 | |
| MAexp20: | 3,208 | |
| MAexp50: | 3,294 | |
| MAexp100: | 3,443 | |
| Price / MA7: | +0.80% | |
| Price / MA20: | +3.06% | |
| Price / MA50: | -2.16% | |
| Price / MA100: | -5.06% | |
| Price / MAexp7: | +0.99% | |
| Price / MAexp20: | +1.68% | |
| Price / MAexp50: | -0.97% | |
| Price / MAexp100: | -5.26% |
About author

Online


Add a comment
Comments
0 comments on the analysis CARNIVAL ORD USD 1.66 - Daily